

13.1 ParticleNet for -jet tagging and mass regression
A ParticleNet model [393] has been trained to classify between background quark and gluon (QCD) jets and signal jets from a boosted spin-0 resonance (X) of mass varying between 15 and 250 and decaying into a pair of quarks, which are categorized into heavy and light flavors: , , and . The mass of the resonance is varied to ensure the tagger cannot use it as a discriminating variable, thereby achieving mass decorrelation. The model inputs are single AK8 jets with up to 100 PF candidates and 7 secondary vertices, each with 42 and 15 features, respectively, while the outputs are the probabilities of the jet to have originated from each of the individual training processes.
We focus on discriminating between jets and QCD by using the discriminant, defined as:
|
| (13.1.1) |
where is the probability of class as outputted by ParticleNet. This discriminator has shown to be highly performant for vs QCD tagging, for example, in the CMS boosted analysis [162].
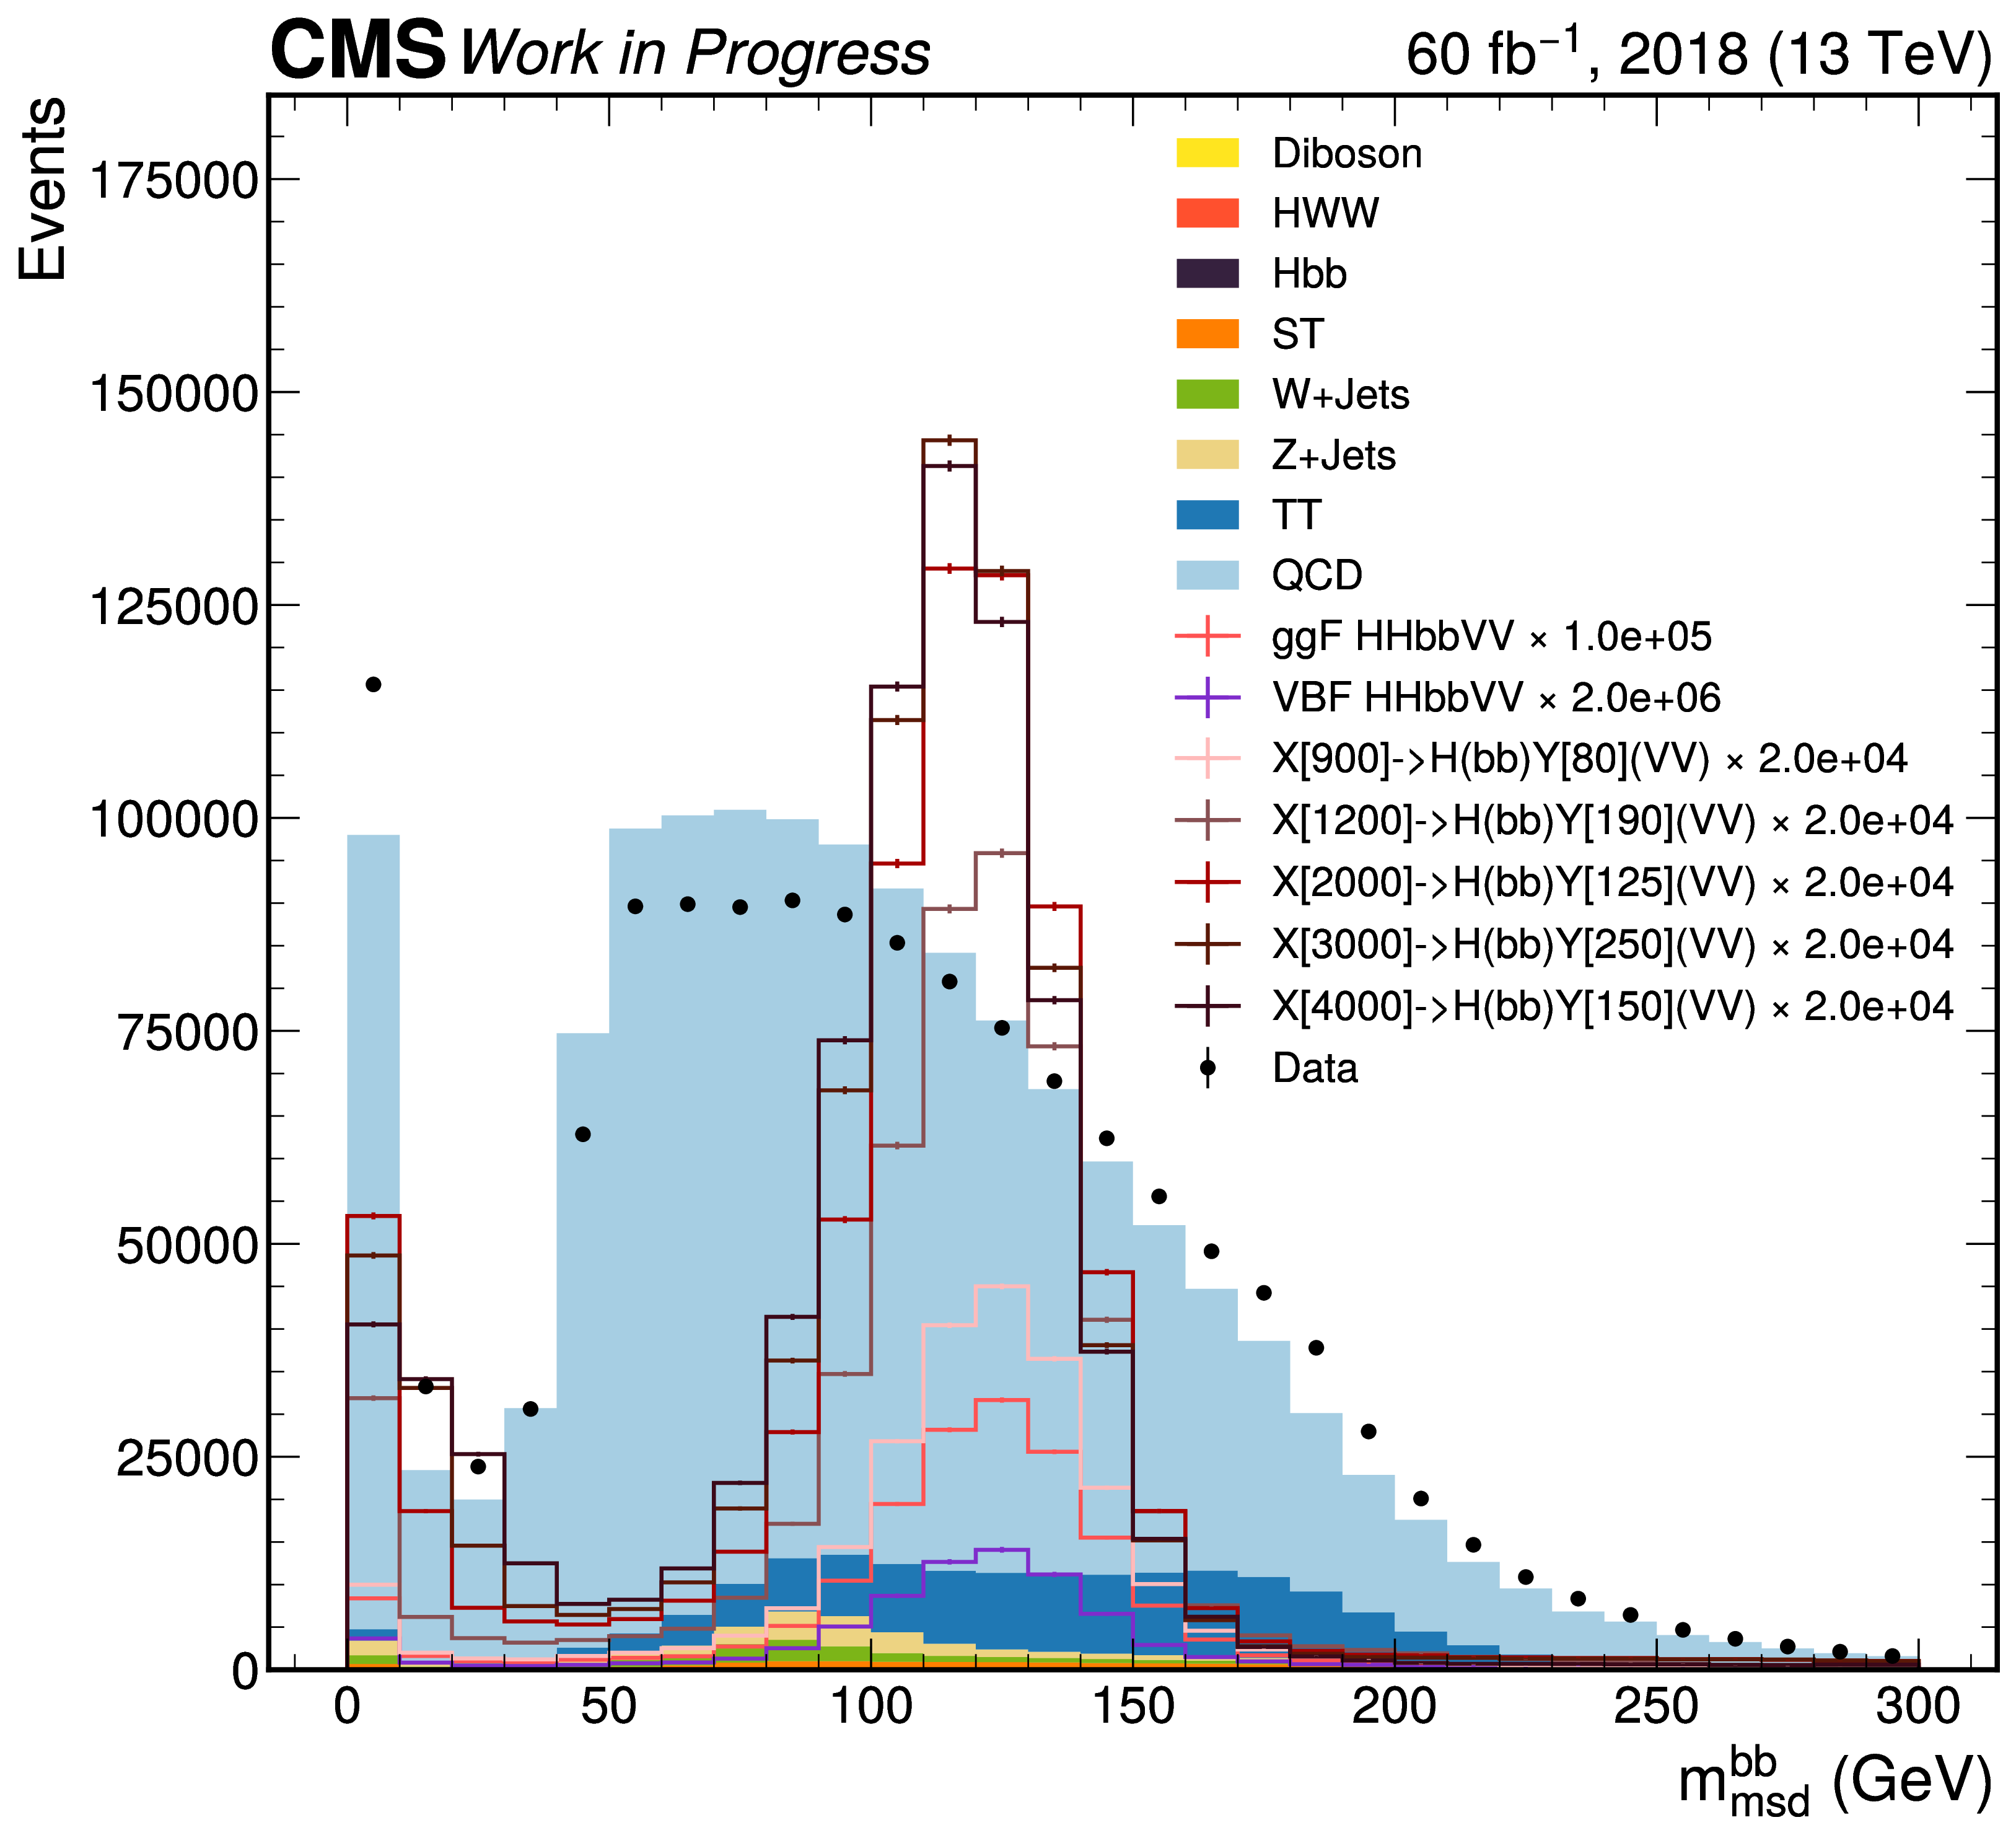
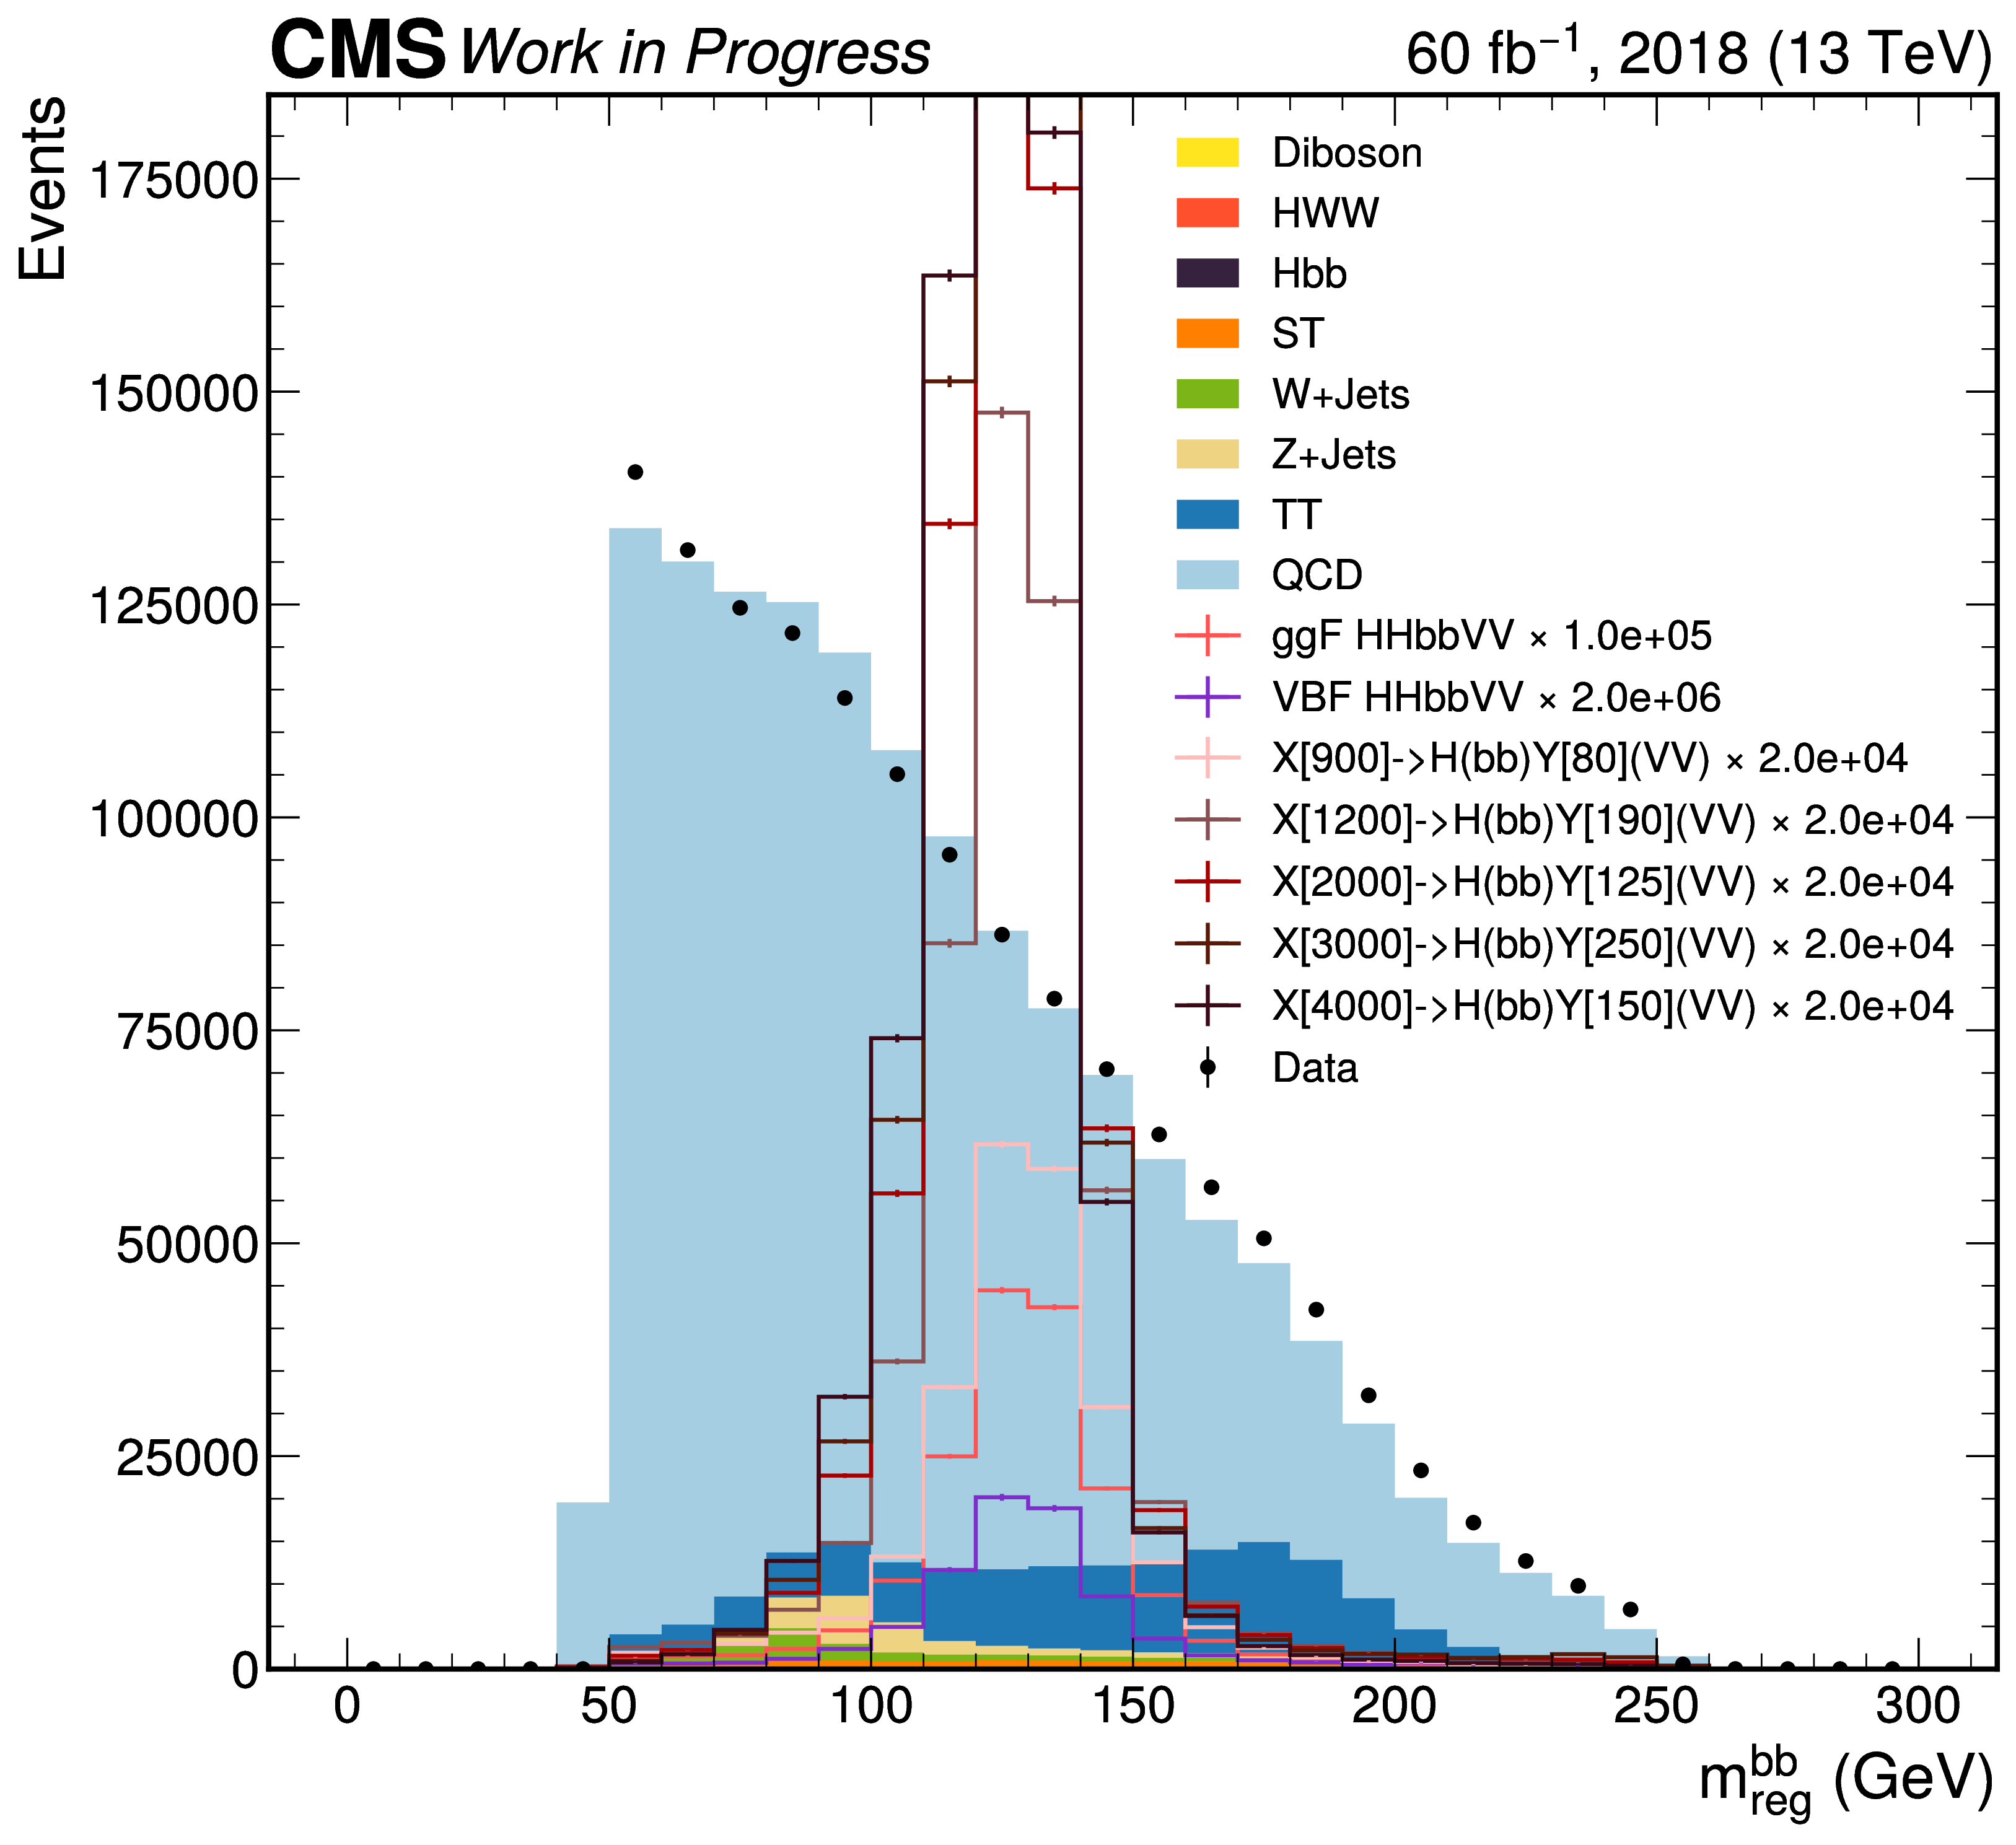
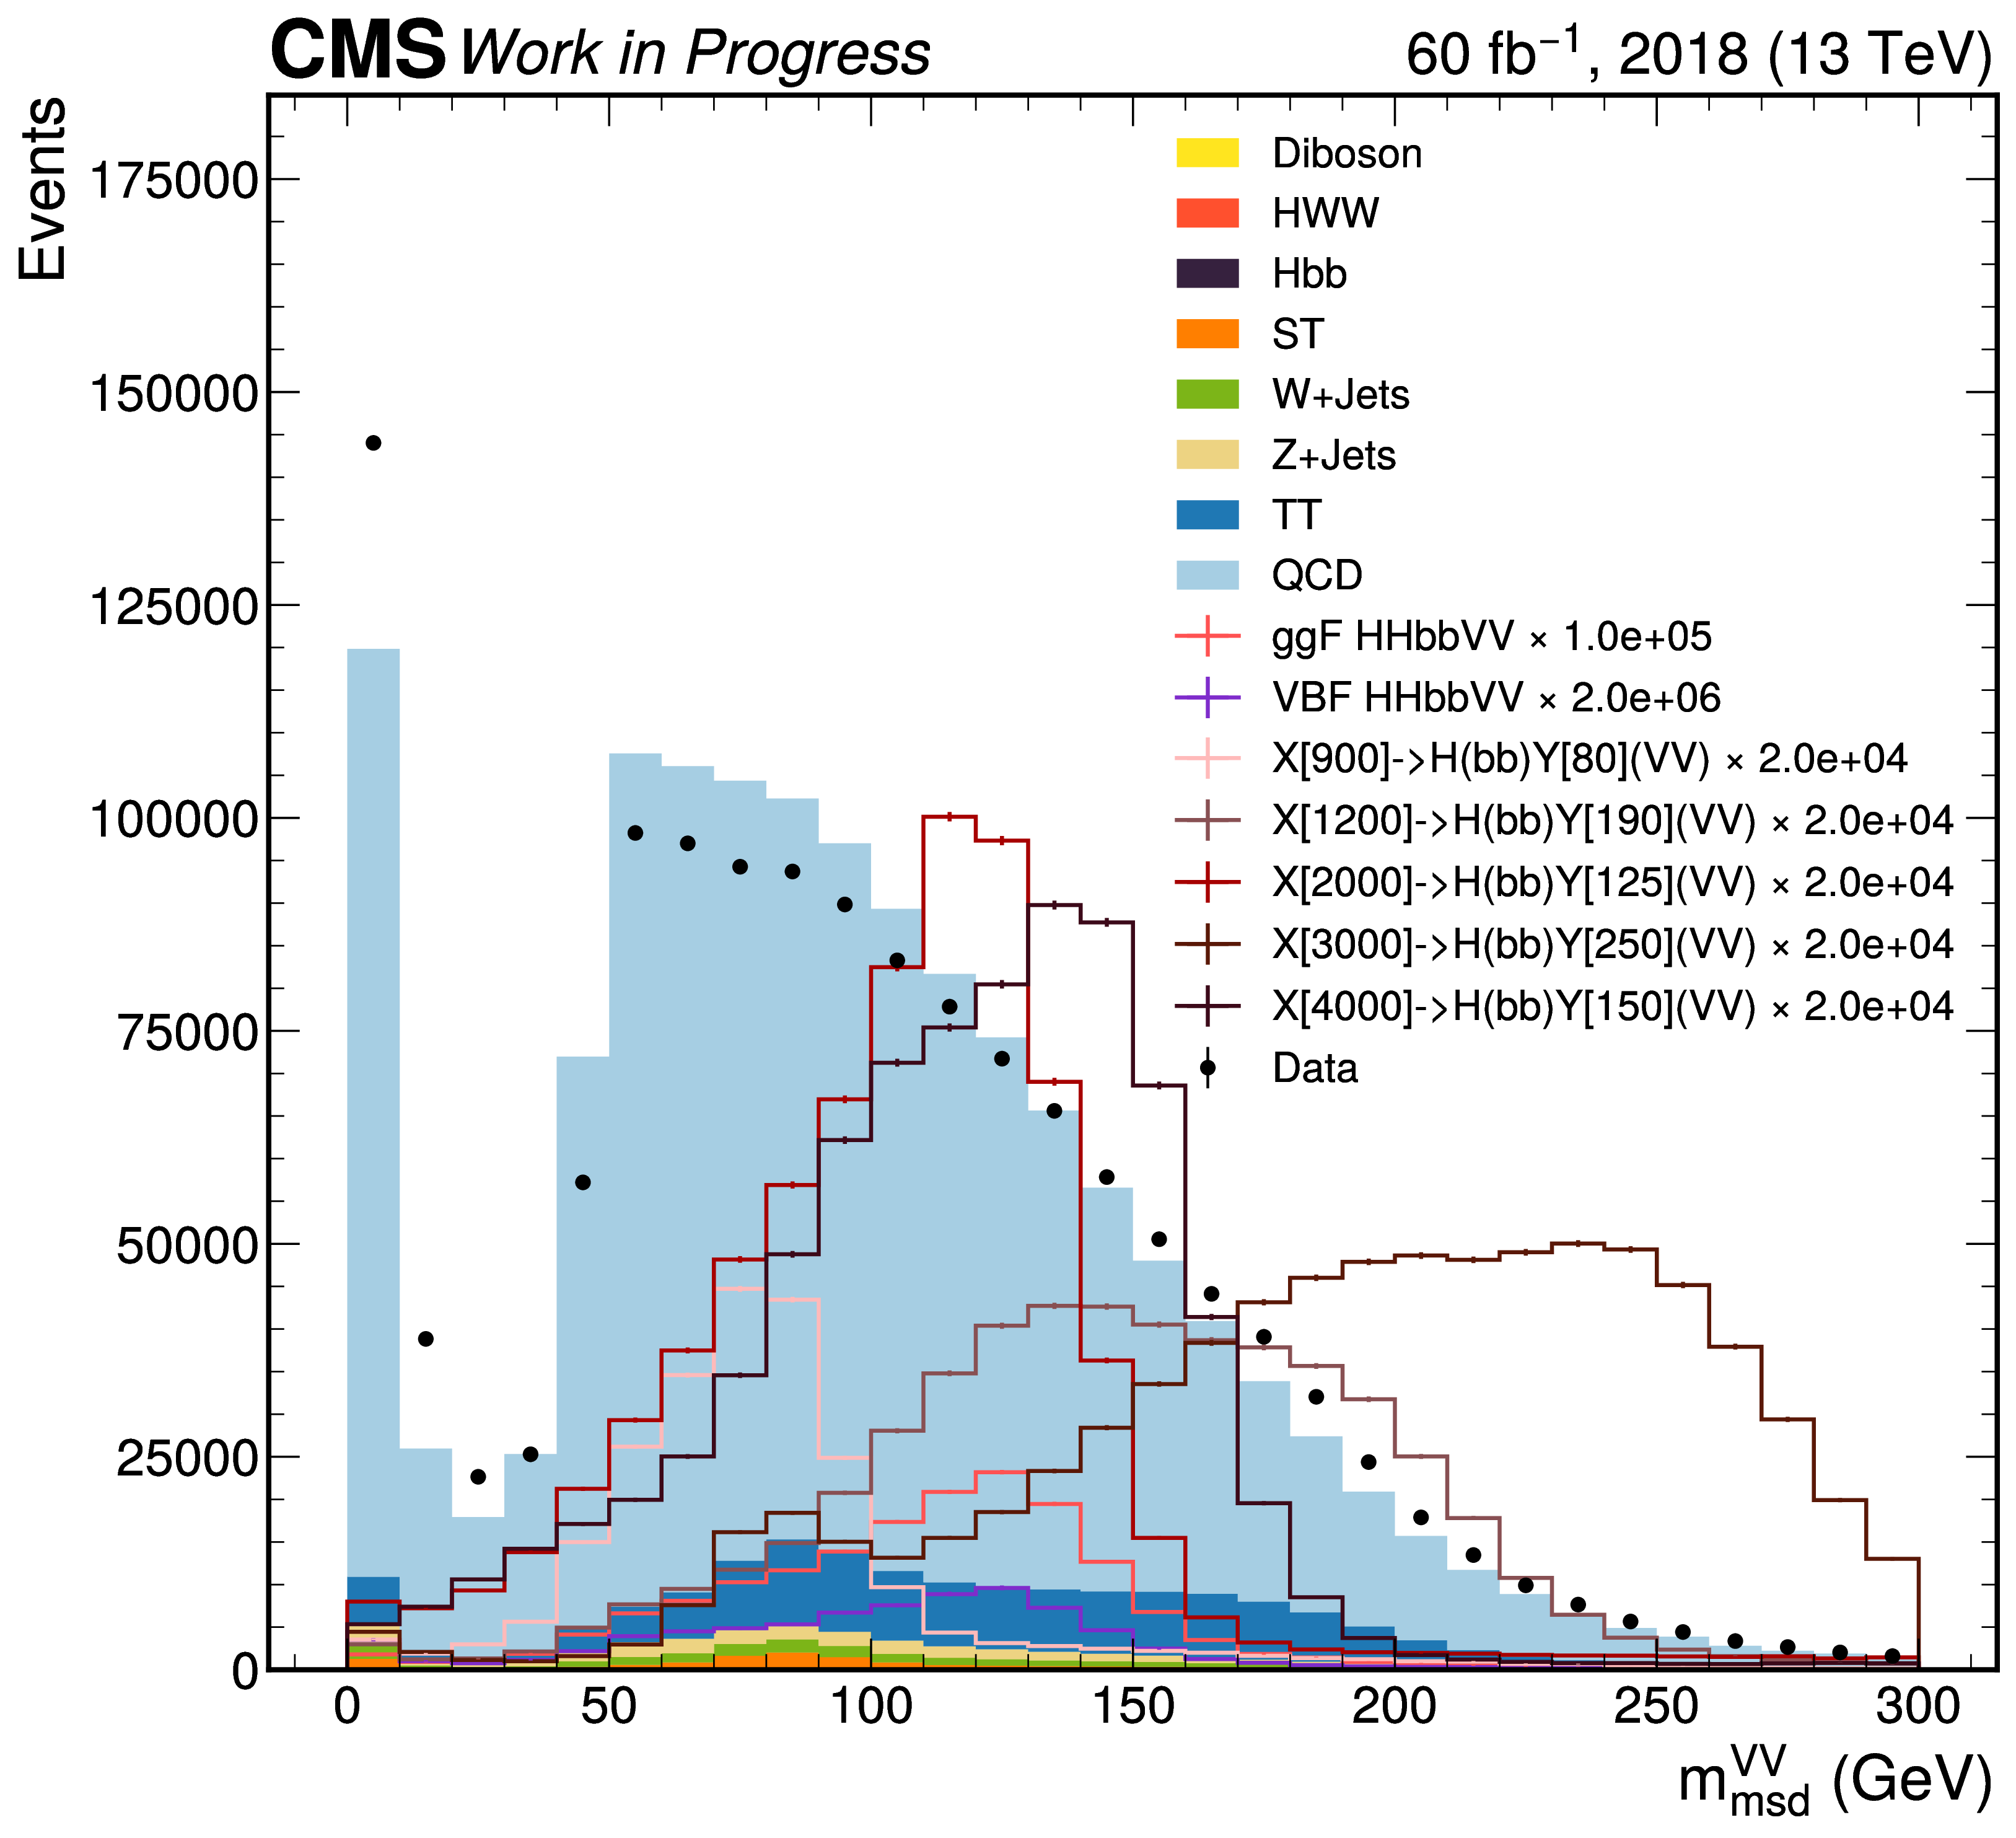
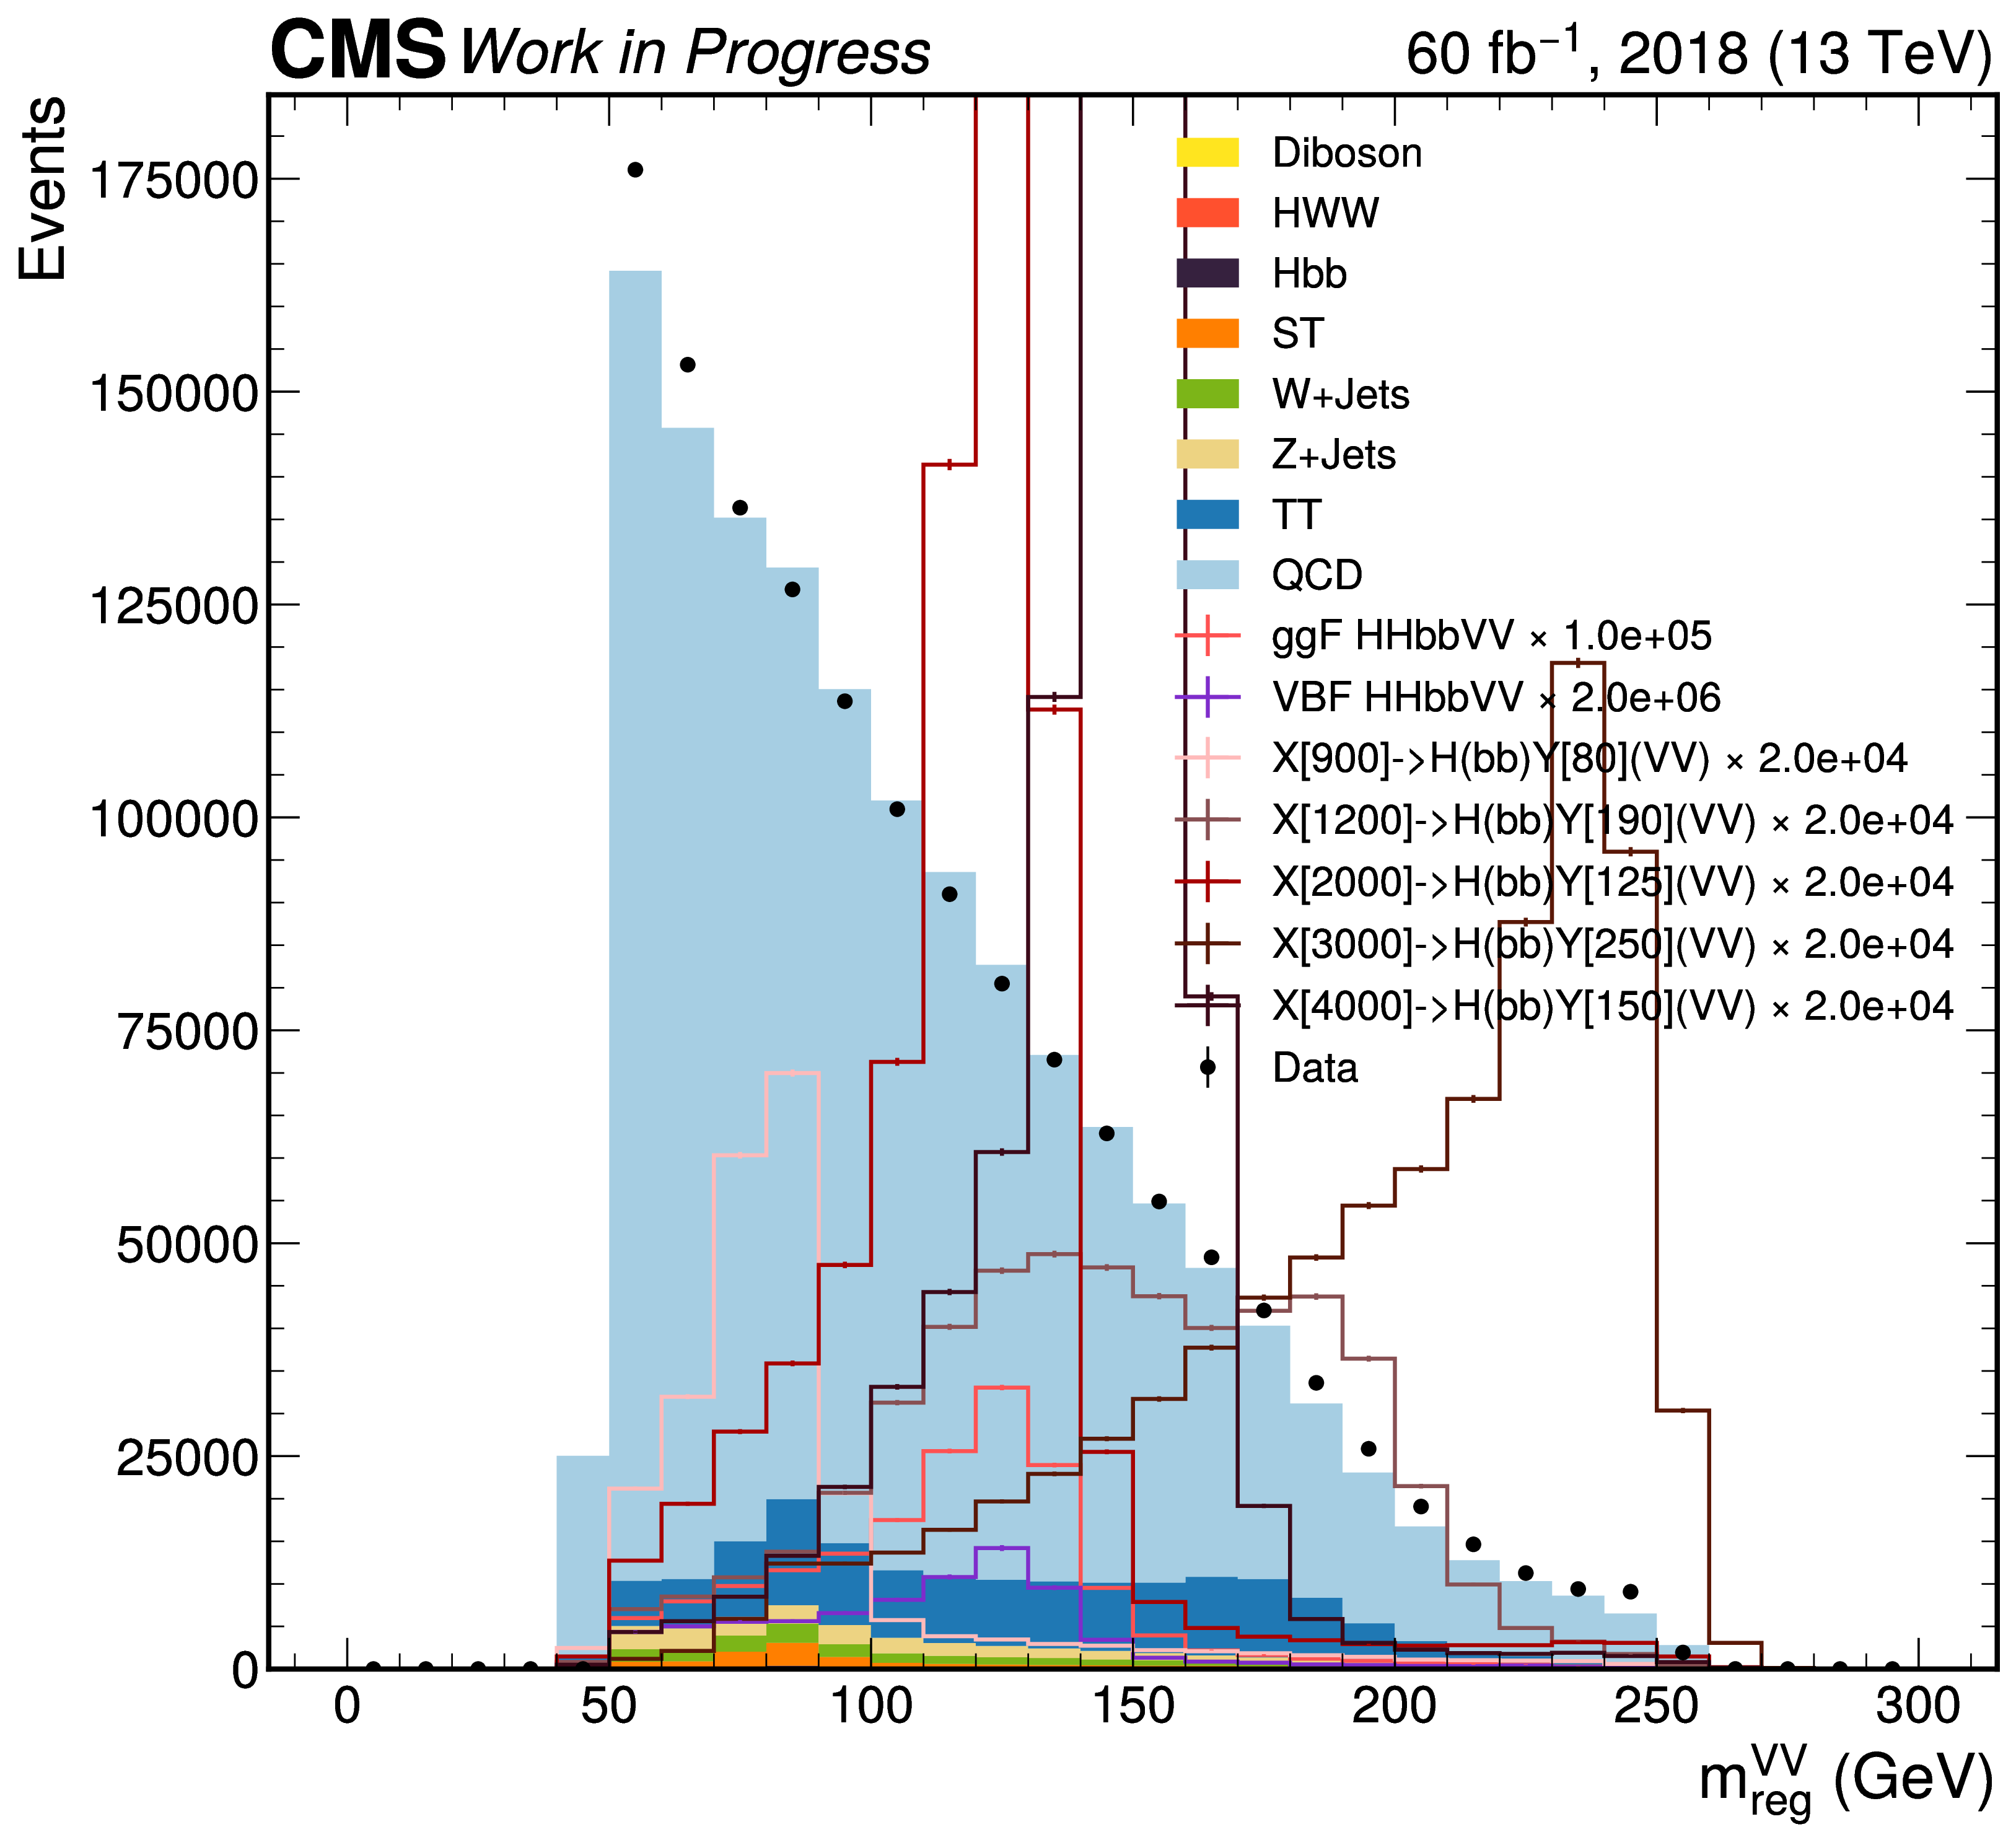
A similar model is also used to regress the mass of wide-radius jets. It is trained on the same set of samples but trained to learn the “true” jet mass, defined as the X mass in the case of signal jets and the generator-level jet mass in the case of QCD jets. A comparison of the traditional soft-drop algorithm [394] () for mass reconstruction and the ParticleNet regressed mass () is shown in Figure 13.1 for the and -candidate jets in the 2018 dataset for data, simulated background events, and a subset of the nonresonant and resonant signal samples. We observe two significant benefits of the regressed mass: 1) the signal mass resolution is significantly improved, especially for the 4-pronged jets; and 2) the regressed mass can recover jets that are too aggressively groomed by the soft-drop algorithm, as indicated by the peak at in and lack thereof in .


