

13.3 Calibrating taggers
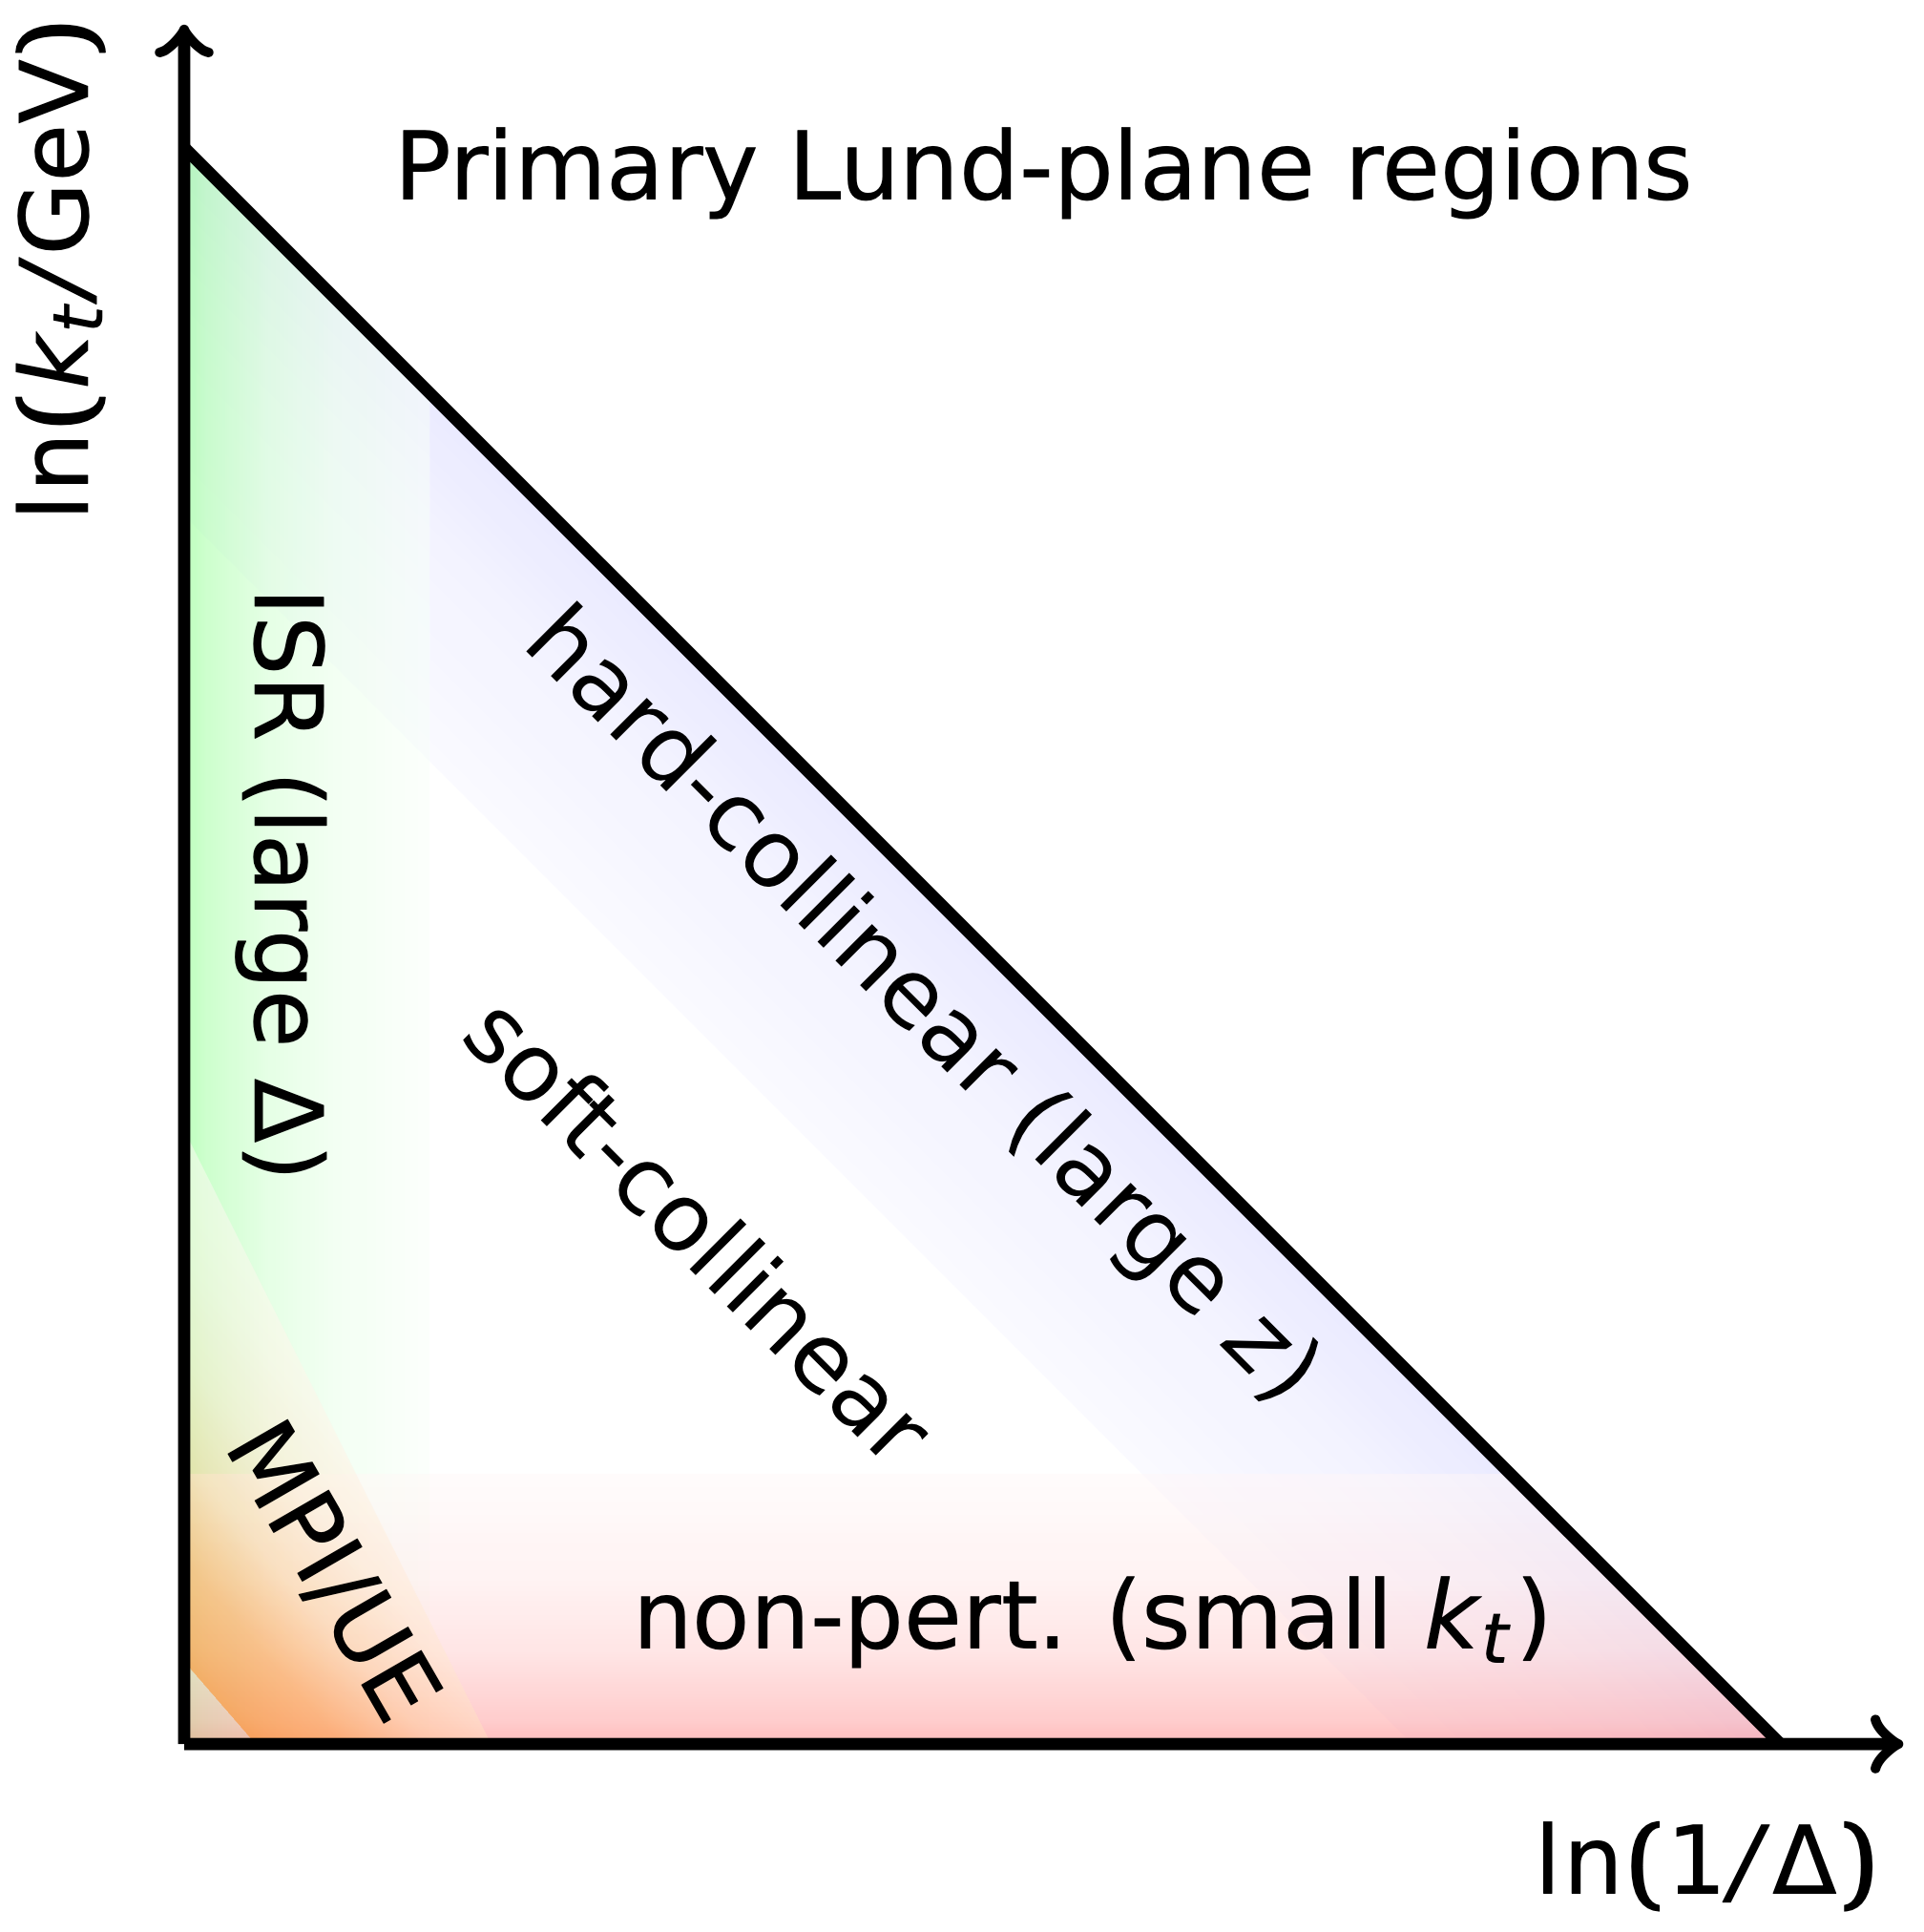
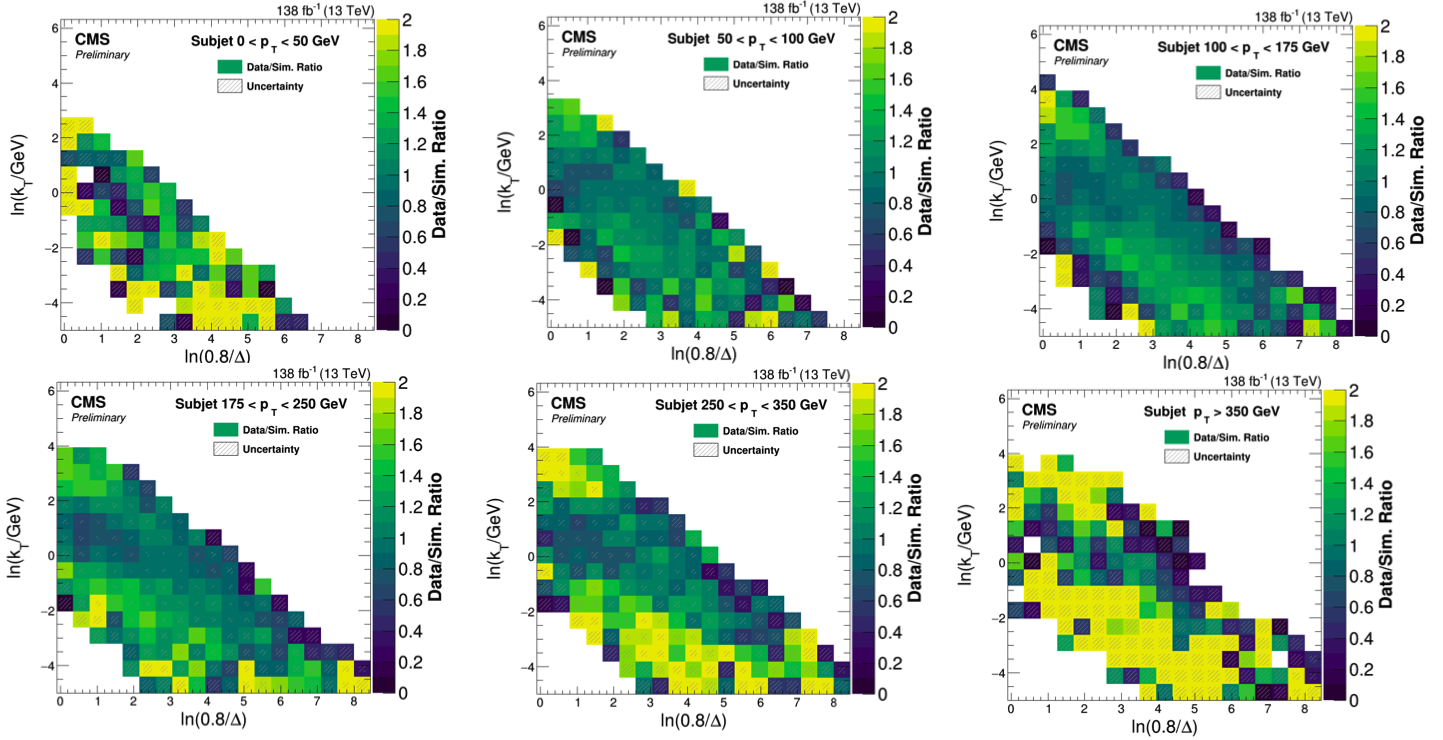
Unlike boosted calibration, where we can use jets as a proxy to measure data versus MC disagreement, it is difficult to define a control region dominated by a standard model candle for the 4-pronged jets. We instead use a method that measures data versus MC differences in the per-prong, or per-subjet, radiation pattern based on densities of their primary Lund jet planes [61]. The primary Lund plane of a jet represents each successive hardest splitting in the 2D (, ) plane, where and are the angular separation and relative transverse momentum between the emitted and emitting particle, respectively. As highlighted in Figure 13.4, the primary Lund plane captures key physics and substructure information about the jet. The data versus MC ratio of the densities of primary Lund planes are measured in Ref. [62] per-subjet in merged two-pronged jets originating from W bosons, clustered with the algorithm [395, 396] to two exclusive jets, binned in subjet , reproduced in Figure 13.4.
A data-to-MC per-event relative weight for the signal is derived by calculating the primary Lund planes for each subjet in the jet, then taking the product across the subjets of each splitting’s data-to-MC correction factor (from Figure 13.4) as a function of its , , and subjet . The signal efficiency scale factor for a BDT selection in the nonresonant analysis, and the selection in the resonant analysis, is thus defined as the ratio of the efficiencies before and after applying the Lund plane weights. Statistical uncertainties and systematic uncertainties related to the MC modeling and extrapolation up to high subjets on the data-to-MC Lund plane ratios are each propagated as sources of systematic uncertainties on the scale factor, as well as an additional factor representing the uncertainty on the quark-subjet matching, as described in detail in Ref. [62]. The measured SFs and uncertainties for different signals and analysis regions are shown in Chapter 14.5.
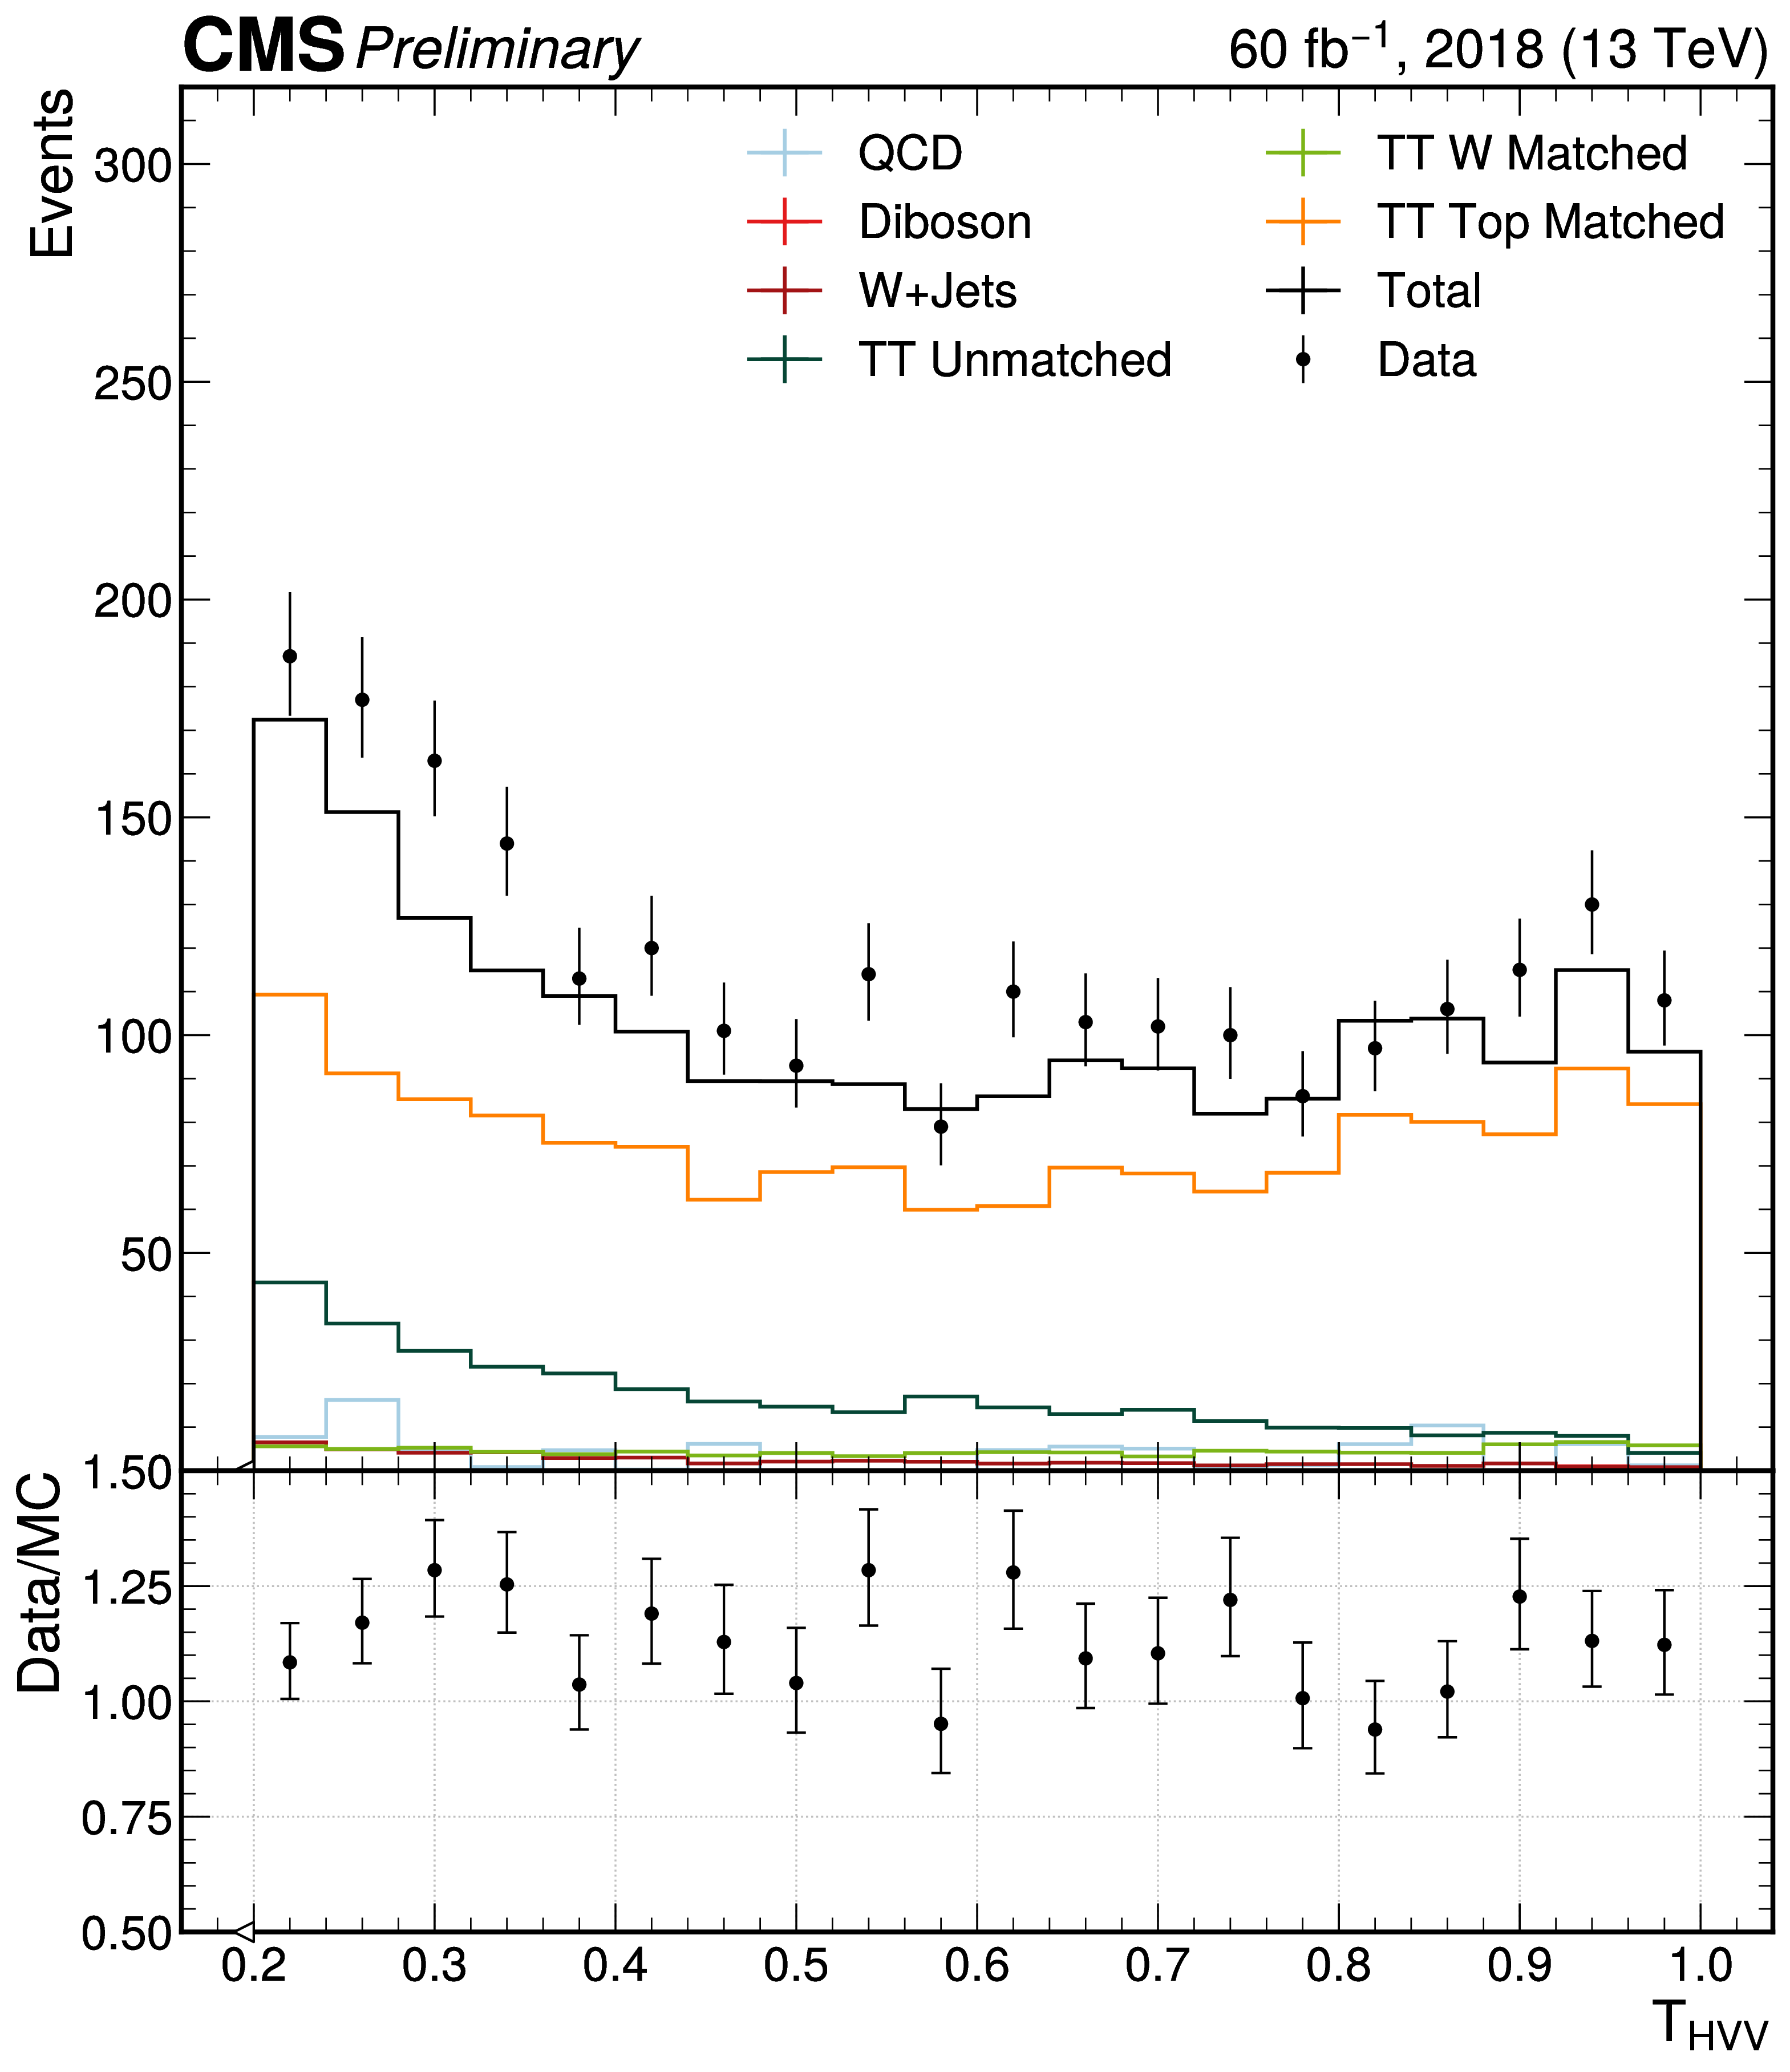
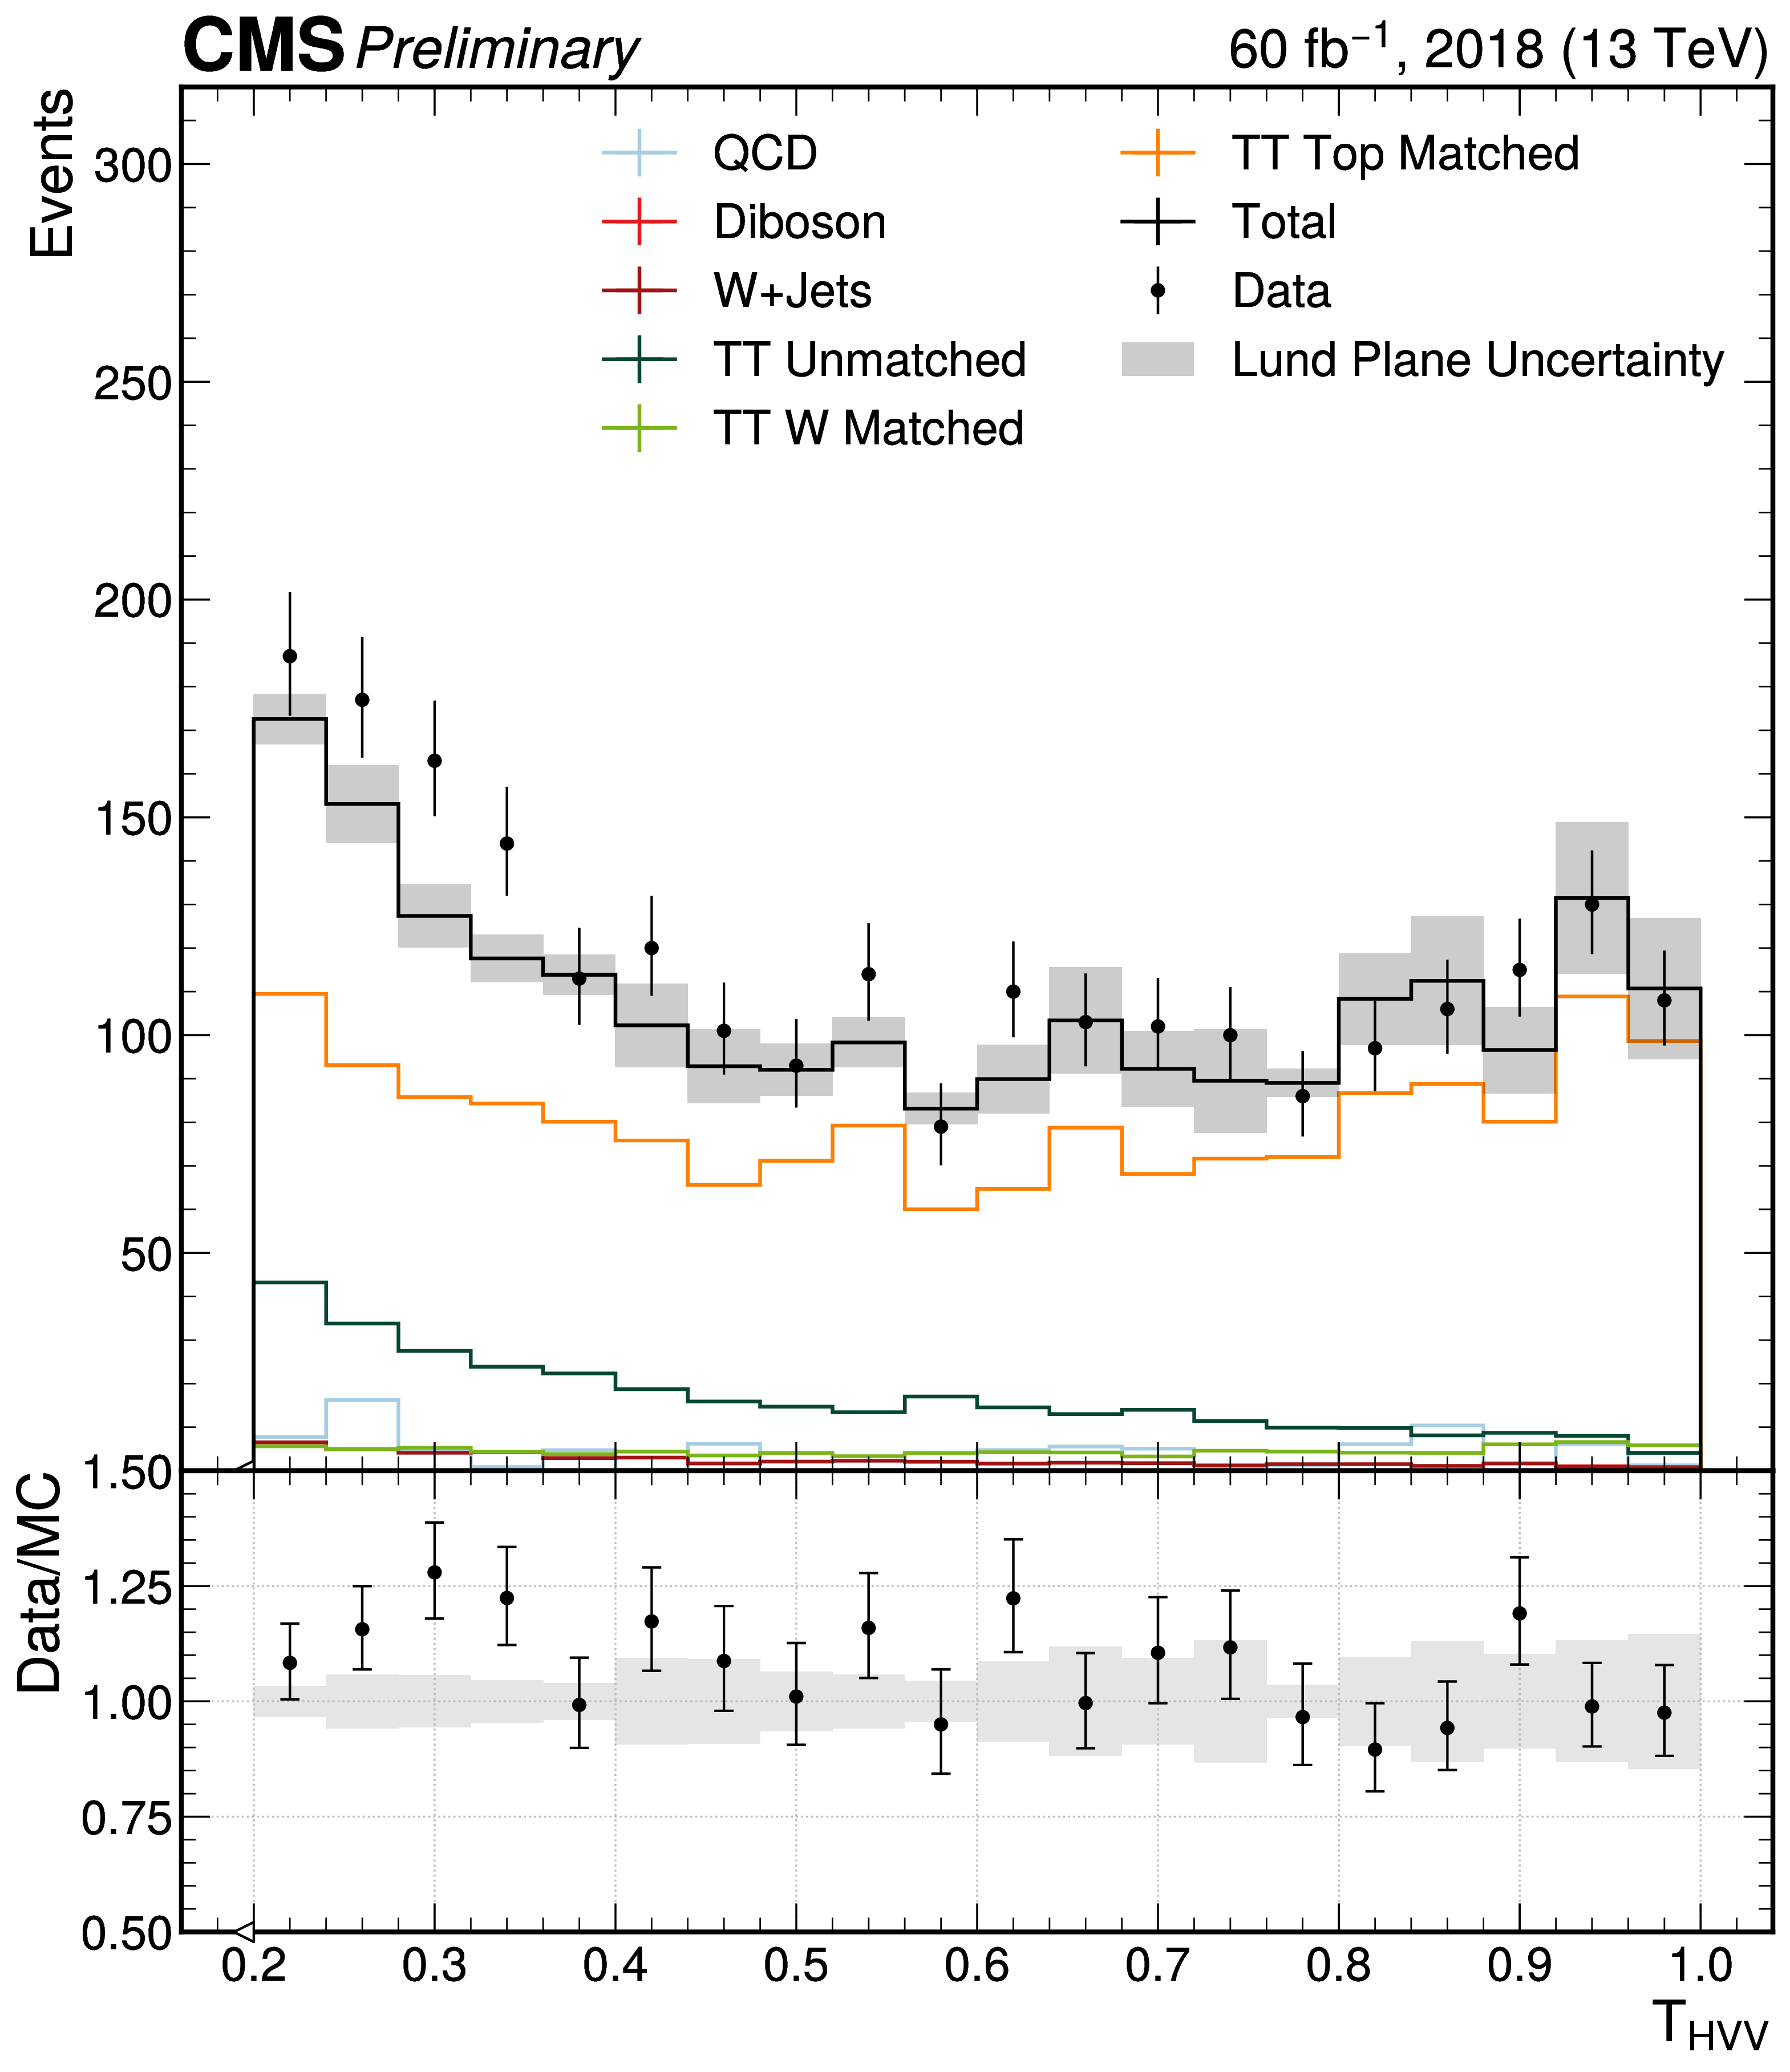
The scale factor measurement is validated for the GloParT on boosted top quark jets. We define a semi-leptonic boosted control region, tagging a leptonically-decaying top quark (), and then probing an opposite-side high AK8 jet representing the hadronically-decaying quark. The event selection follows that of the control region in Ref. [62], comprising online muon triggers, and offline selections for a b-tagged AK4 jet, a leptonically-decaying W boson — based on the presence of a muon and missing transverse energy — and a high AK8 jet with mass close to that of the top quark. Jets from the MC samples are categorized using generator-level particles as either: “top matched” — all three daughter quarks lying within the jet; “W matched” — only the W daughter quarks inside the jet; or “unmatched” — neither of these two cases. Only the top-matched jets are reweighted with the Lund plane ratios.
We consider the discriminant from Eq. 13.2.1, excluding in the denominator to ensure top quark events are retained in the high tagger score bins. Plots of the distribution from the 2018 datasets before and after Lund plane reweighting of the top-matched jets are shown in Figure 13.5. The combined uncertainties per bin are also shown in the distributions and data/MC ratios. We observe an overall improvement in data/MC agreement in the highest bins (), with the -test value between MC and data yields improving from 16.6 to 10.9. The data and MC yields are all consistent within in these bins.
Acknowledgements
This chapter, in part, is currently being prepared for the publication of the material by the CMS collaboration. The dissertation author was the primary investigator and author of these papers.


