Table of ContentsMy websiteDownload PDFGitHub Repository

11.4 Demonstration on particle cloud GANs

We now provide a practical demonstration of the efficacy of our proposed metrics in evaluating the high-performing generative model discussed previously in this chapter: MPGAN, GAPT, GAST, and iGAPT. The visual comparison between the iGAPT and MPGAN models has been shown in Figure 10.10, demonstrating the high performance, but also the difficulty in distinguishing visually between the two models and the real jets. This makes these models an effective test bench for our proposed metrics.

PIC

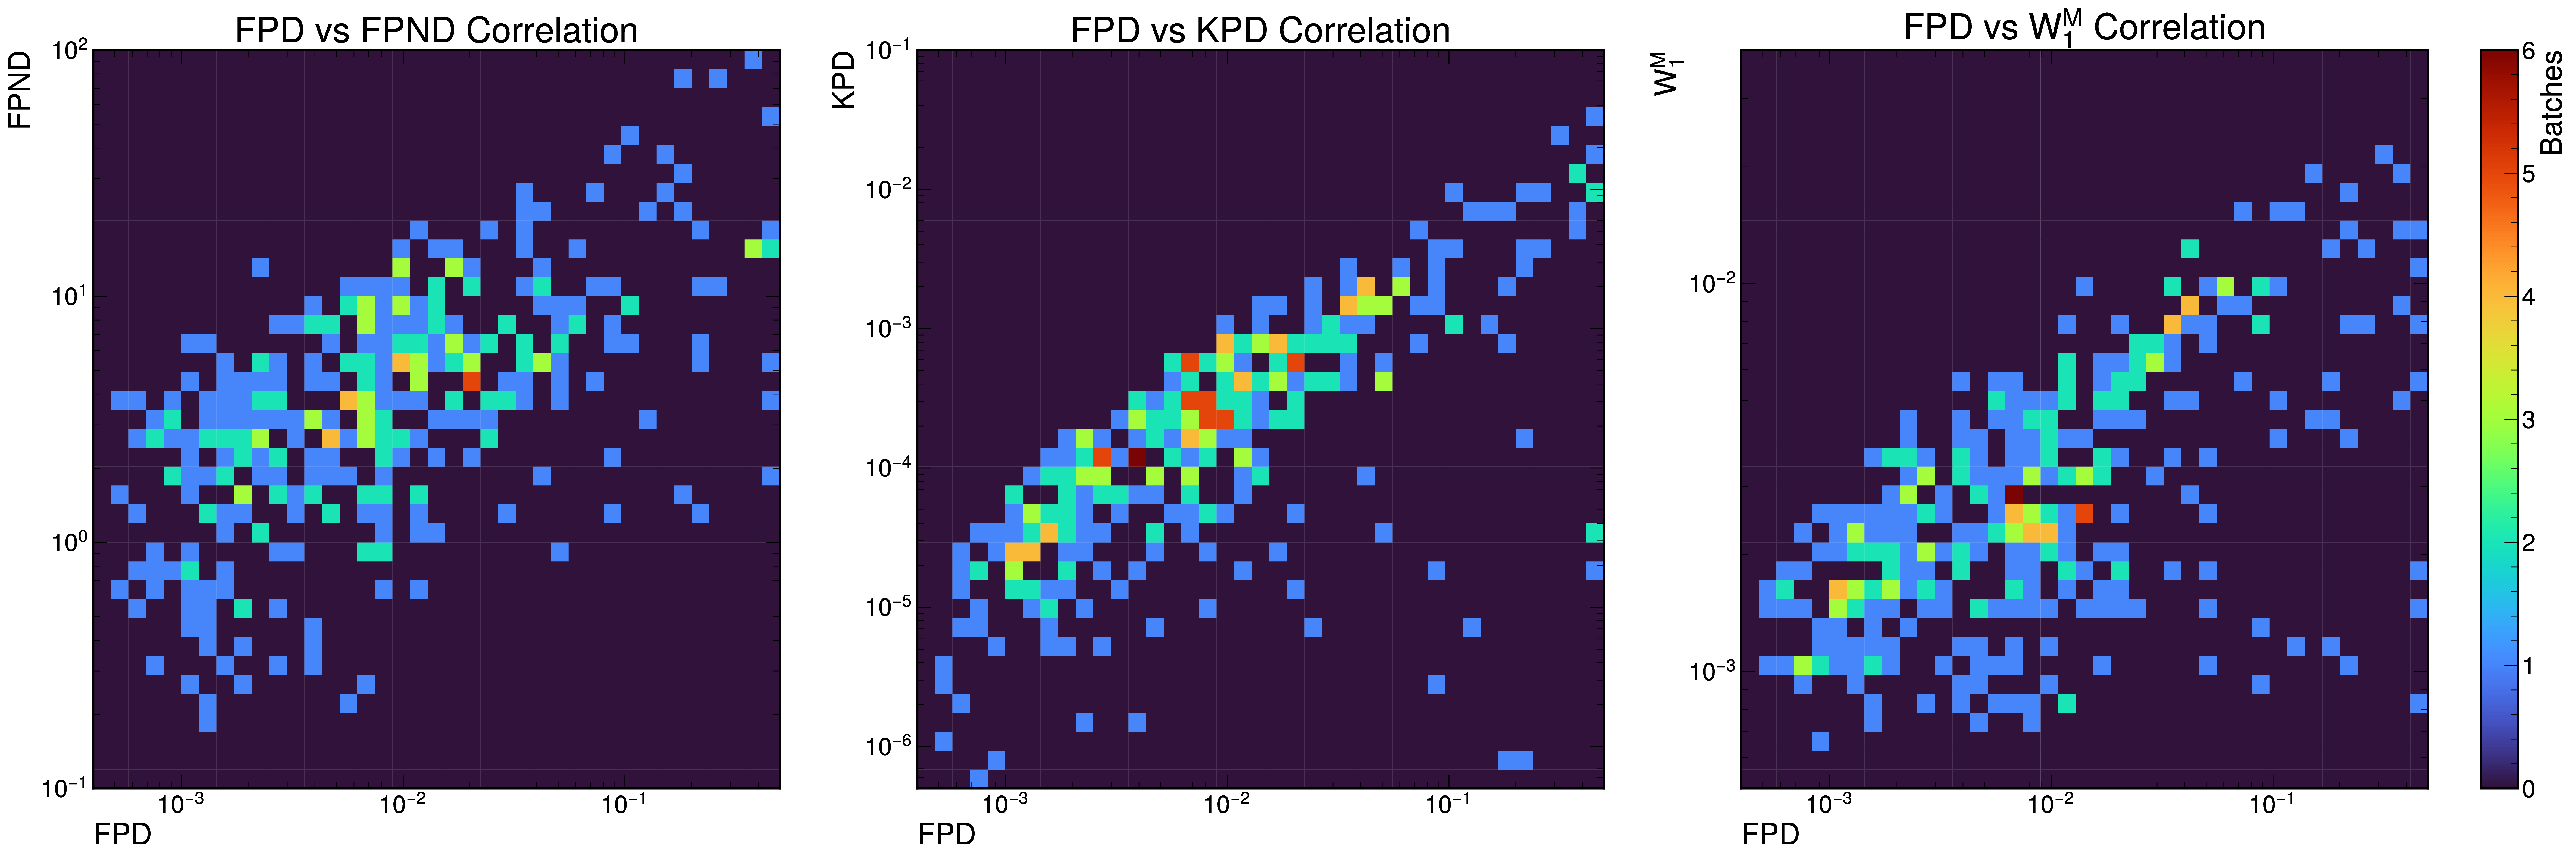
Figure 11.4. Correlations between FPD and FPND, KPD, and W1M on 400 separate batches of 50,000 GAPT-generated jets.

Figure 11.4 first shows correlation plots between FPD and FPND, KPD, and W1M on 400 separate batches of 50,000 GAPT-generated jets. We observe an overall positive relationship between the metrics, as one might expect. FPD and KPD have the strongest correlation, likely because they are accessing similar information about the same set of input features. However, for low values, the correlation is weak between all metrics, indicating that these metrics are complementary in understanding different aspects of the model’s performance. As noted in Section 11.3, the correlation between FPD and FPND may improve if the former were to use a subset of lower-level particle features as well.

Table 11.3. Evaluation metrics for different jet types and models. The best-performing model on each metric and jet type is highlighted in bold.
------------------|-------------------------------------------------------------------
                  |              preTl   −3      M    − 3           − 3            −6
                   Model      W 1p  (10  )   W 1 (10   )  FPD  (10   )  KPD   (10  )
------------------|-------------------------------------------------------------------
                  |Truth       0.14 ± 0.06    0.46 ± 0.08   0.14 ± 0.04    1.8 ± 11.9
                  |
                  |MPGAN       0.27 ± 0.02     0.7 ± 0.3    0.41 ± 0.09      0 ± 8
                  |
 Gluon (30 )      |GAPT       0.25 ±  0.07    1.0 ± 0.2    0.46 ± 0.06      5 ± 3
                  |
                  |GAST         0.8 ± 0.1      0.7 ± 0.2    0.40 ± 0.05    7.0 ± 10.3
                  |
                  |iGAPT       0.76 ± 0.07    0.7 ± 0.1    0.29 ± 0.04      3 ± 5
------------------|-------------------------------------------------------------------
                  |Truth       0.21 ± 0.05     0.5 ± 0.2    0.09 ± 0.03     − 3 ± 3
                  |
                  |MPGAN      0.41 ±  0.07   0.5 ± 0.1     1.9 ± 0.2     1.7 ± 15.1
                  |
 Light quark (30) |GAPT        2.74 ± 0.09    2.54 ± 0.05   4.03 ± 0.06      96 ± 9
                  |
                  |GAST         1.2 ± 0.1      1.8 ± 0.2    0.65 ± 0.07   27.0 ± 11.7
                  |
                  |iGAPT       1.89 ± 0.04     1.2 ± 0.3    0.51 ± 0.07      12 ± 7
------------------|-------------------------------------------------------------------
                  |Truth       0.20 ± 0.05     0.7 ± 0.2    0.07 ± 0.03     − 16 ± 2
                  |
                  |MPGAN       0.44 ± 0.08    0.5 ± 0.1     2.8 ± 0.2    14.7 ± 12.9
                  |
 Top quark  (30)  |GAPT       0.34 ±  0.02    1.9 ± 0.2    0.43 ± 0.03   25.4 ± 28.8
                  |
                  |GAST        1.16 ± 0.08     1.5 ± 0.2    0.30 ± 0.05   − 2.4 ±  17.2
                  |
                  |iGAPT       0.54 ± 0.04     0.9 ± 0.3    0.25 ± 0.03   − 0.6 ± 14.1
------------------|-------------------------------------------------------------------
                  |Truth       0.09 ± 0.03     0.7 ± 0.2    0.10 ± 0.03    0.5 ± 10.5
                  |
                  |GAPT        0.77 ± 0.03    1.1 ± 0.3     22.0 ± 0.1    62.5 ± 11.1
 Gluon (150 )     |
                  |GAST        0.68 ± 0.05     3.7 ± 0.3    3.60 ± 0.06   47.7 ± 13.8
                  |
                  |iGAPT      0.66 ±  0.03    4.4 ± 0.7    2.99 ± 0.06   158.1 ± 37.9
--------------------------------------------------------------------------------------

Next, FPD, KPD, W1M scores, as well as the W1 distance between the particle pTrel distributions, from the best-performing MPGAN, GAPT, GAST, and iGAPT models are shown in Table 11.3, respectively. Focusing on just the 30-particle gluon jets first, we observe that it is extremely difficult to either distinguish between the performance of the models or draw a conclusion for their viability as alternative simulators based only on visual inspection of the histograms or even the W1M score. However, FPD provides crucial information in this regard clearly indicating that iGAPT is outperforming the other models, validating our physics-informed approach to its architecture. However, we see that the FPD scores are discrepant from the truth, indicating room for improvement.

Overall, we see from this experiment the value in employing a broad set of sensitive, interpretable metrics. Firstly, evaluators can identify specific points of failures in their models. In the case of iGAPT, we note that while its W1M, FPD and KPD scores are generally strong, it is consistently worse than MPGAN on W1ppTrel, indicating difficulty in learning the particle-level features — likely because of the increased emphasis on high-level, jet, features in the IPAB architecture. Secondly, evaluators are also able to define clear, quantitative criteria for model selection for their downstream tasks: for example, if comparing different simulator options, they can simply choose the model with the lowest FPD score, or if validating a faster alternative to traditional, accurate simulations, they may wish to require all scores to be compatible (e.g., significances of < 2) with the latter, or even with LHC data itself, before adopting the model.