

11.3 Experiments on jet data
We next test the performance of the Wasserstein distance, , MMD, precision, and recall on high momentum gluon jets from the JetNet dataset. As discussed in Section 11.1, we test all metrics on two sets of features per jet: (i) physically meaningful high-level features and (ii) features derived from a pretrained classifier. We choose a set of 36 energy flow polynomials (EFPs) [322] (all EFPs of degree less than five) for the former, as they form a complete basis for all infrared- and collinear-safe observables. The classifier features are derived from the activations of the penultimate layer of the SOTA ParticleNet [230] classifier, as described in Section 10.1. Finally, we test the binary classifier metric as in Refs. [365, 366] using both ParticleNet directly on the low-level jet features and a two-layer fully connected network (FCN) on the high-level EFPs. We note that Refs. [365, 366] do not provide a recipe for measuring the null distribution, instead relying on direct comparisons between area under the curve (AUC) values, which is a limitation of this classifier-based metric. We first describe the dataset and tested distortions, and then the experimental results.
Dataset
As our true distribution we use simulated gluon jets of transverse momentum () from the JetNet dataset (Section 9.2) using the associated JetNet library (Section 15). We again consider the three particle features: relative angular coordinates and , and the relative transverse momentum . To obtain alternative distributions we distort the dataset in several ways typical of the mismodeling we observe in ML generative models: lower feature resolution, systematic shifts in the features, and inability to capture the full distribution.
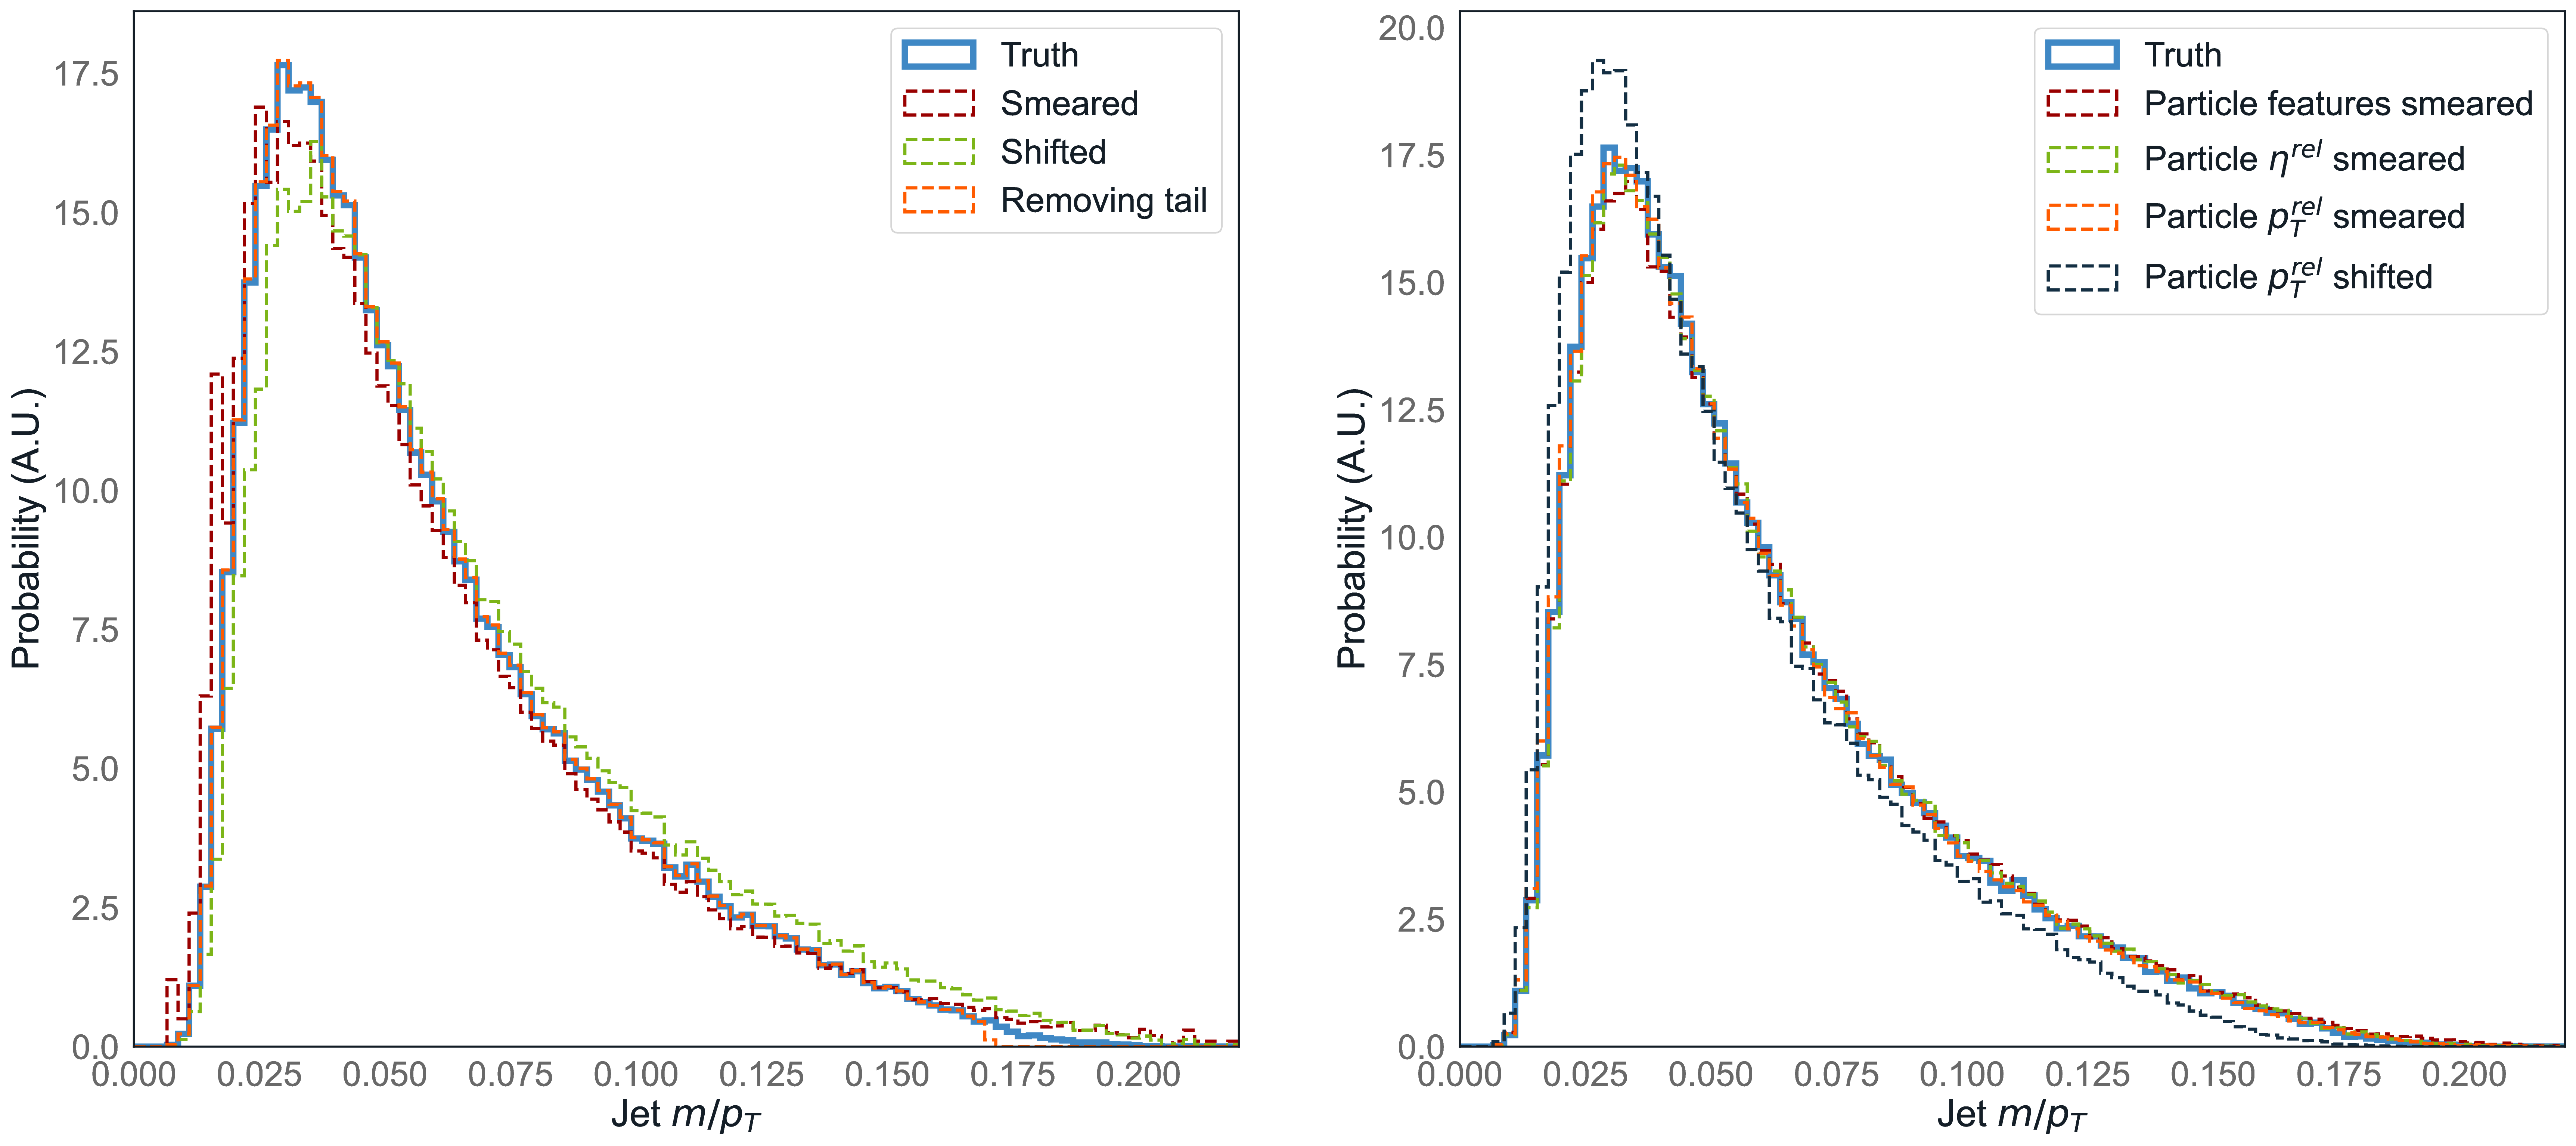
We perform both distribution-level distortions, by reweighting the samples in jet mass to produce a mass distribution that is (i) smeared, (ii) smeared and shifted higher, and (iii) missing the tail of the distribution, as well as direct particle-level distortions, by (iv) smearing all three , , and features, smearing the (v) and (vi) individually, and (vii) shifting the higher. The effects of the distortions on the relative jet mass are shown in Figure 11.3, with further plots of different variables available in Appendix D.3.
Results
Table 11.2 shows the central values, significances, and errors for each metric, as defined in Section 11.2, with the most significant scores per alternative distribution highlighted in bold. The first row shows the Wasserstein distance between only the 1D jet mass distributions () as introduced in Section 10.1, as a test of the power and limitations of considering only 1D marginal distributions. We see that, in fact, identifies most distortions as significantly discrepant but is not as sensitive to subtle changes such as particle smearing. Additionally, even with up to 50,000 samples, it is unable to converge to the true value. Nevertheless, it proves to be a valuable metric that can be used for focused evaluation of specific physical features, complementing aggregate metrics.
The next five rows show values for metrics which use EFPs as their features. We find that, perhaps surprisingly, is the most sensitive to all distortions, with significances orders of magnitude higher than the rest. The Wasserstein distance is not sensitive to many distortions for the sample sizes tested, while the MMD is successful, but not as sensitive as . It is also clear that precision and recall have difficulty discerning the quality and diversity of distributions in high-dimensional feature spaces, which is perhaps expected considering the difficulty of manifold estimation in such a space.
An extremely similar conclusion is reached when considering the metrics using ParticleNet activations, with again the highest performing. Broadly, ParticleNet activations allow the metric to distinguish particle-level distortions slightly better, and vice versa for distribution-level distortions, although overall the sensitivities are quite similar. We posit that including a subset of lower-level particle features in addition to EFPs could improve sensitivity to particle-level distortions, a study of which we leave to future work.
Finally, the last two rows provide the AUC values for a ParticleNet classifier trained on the particle low-level features (LLF), and an FCN trained on high-level features (HLF). We find that while both appear to be able to distinguish well the samples with particle-level distortions, they have no sensitivity to the distribution level distortions.
In conclusion, we find from these experiments that is in fact the most sensitive metric to all distortions tested. Despite the Gaussian assumption, it is clear that access to the first-order moments of the distribution is sufficient for it to have high discriminating power against the relevant alternative distributions we expect from generative models.
Applying to hand-engineered physical features or ParticleNet activations leads to similar performance, with the former having a slight edge. In addition, using physical features—Fréchet physics distance (FPD) for short—has a number of practical benefits. For instance, it can be consistently applied to any data structure (e.g. point clouds or images) and easily adapted to different datasets as long as the same physical features can be derived from the data samples (Ref. [279] and Section 10.1 derive similar jet observables from images and point clouds, respectively). These are both difficult to do with features derived from a pretrained classifier, where different classifier architectures may need to be considered for different data structures and potentially even different datasets. FPD is also more easily interpreted, as evaluators have more control and understanding of the set of features they provide as input.
Hence, we propose FPD as a novel efficient, interpretable, and highly sensitive metric for evaluating generative models in HEP. However, MMD on hand-engineered features—kernel physics distance (KPD) for short—and scores between individual feature distributions also provide valuable information and, as demonstrated in Section 11.2, can cover alternative distributions for which FPD lacks discriminating power.
